Figures & data
Table 1. Overview of experiments.
Table 2. Descriptive statistics.
Figure 1. Experiment I testing effect of inclusion on emotional response, barplot with standard error bars. Note: Full regression, see .
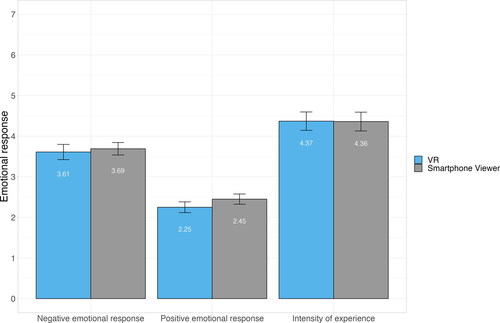
Figure 2. Experiment II testing effect of inclusion on emotional response, barplot with standard error bars. Note: Only result of intensity is significant (b = 1.3, se=.462, p=.008).
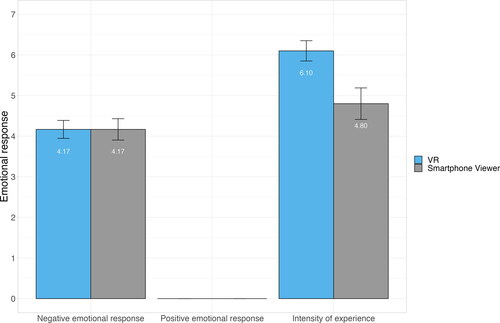
Table 3. Effect of IJ characteristics on emotional responses.
Figure 3. Effect of immersive narratives on emotional response, barplot with standard error bars. Note: Only negative emotions (b=.621, se=.236, p=.01) is significant.
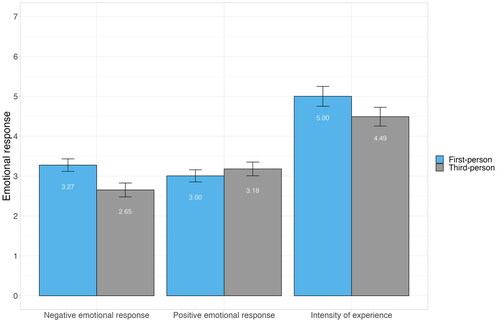
Figure 4. Effect interaction possibilities vs. no interaction possibilities on emotional response, barplot with standard error bars. Note: Only result of intensity (b=.932, se=.365, p=.01) is significant.
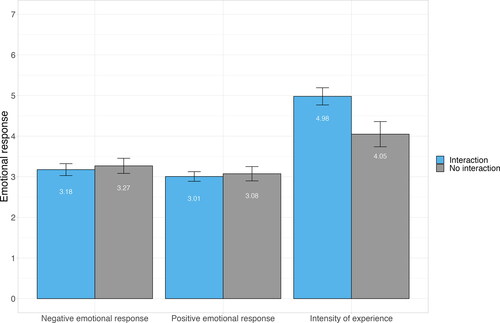
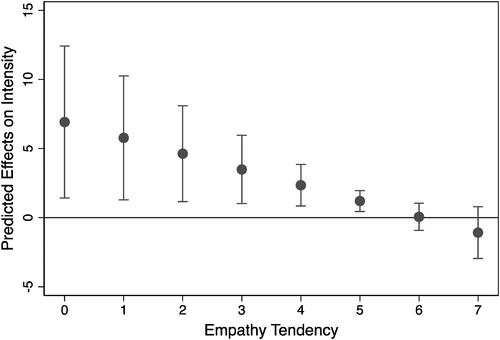
Figure 5. Marginal effects plot of moderating role of empathy tendency on effect of immersive narrative on positive emotions. Note: Adjusted predictions of effect of immersive narrative with 95% CIs.
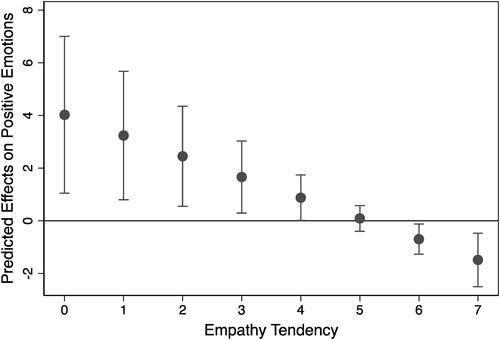
Figure 6. Marginal effects plot of moderating role of empathy tendency on effect of interactivity on intensity evaluations. Note: Adjusted predictions of effect of interactivity with 95% CIs.