Figures & data
Figure 1. Theoretical model.
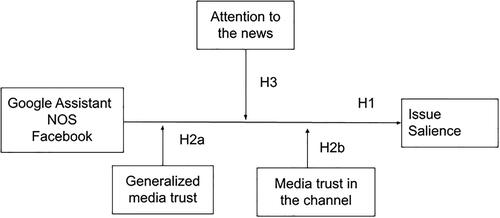
Table 1. Means and stand deviations of moderators per channel.
Table 2. Model outline overview.
Table 3. Model comparisons.
Figure 2. Estimated probabilities of issue salience agreement across models.Footnote1
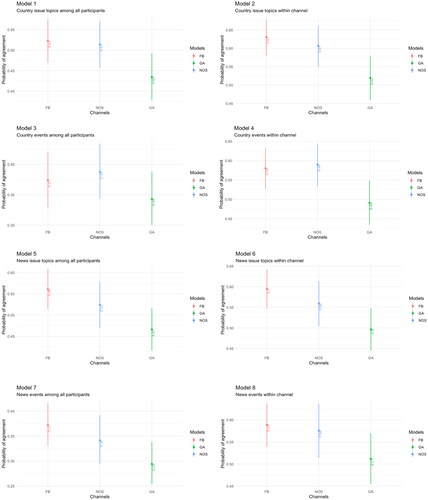
Figure 3. Estimated probabilities of generalized media trust across models.Footnote2
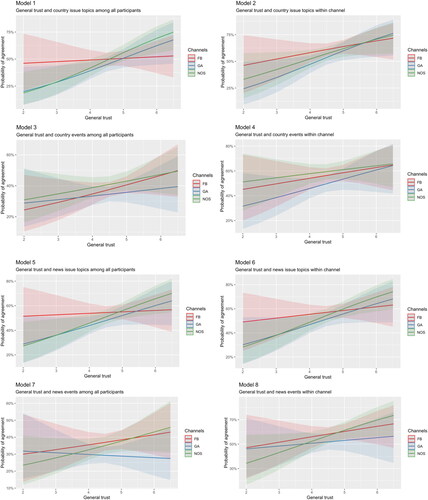
Figure 4. Estimated probabilities of trust in the channel across models.Footnote3
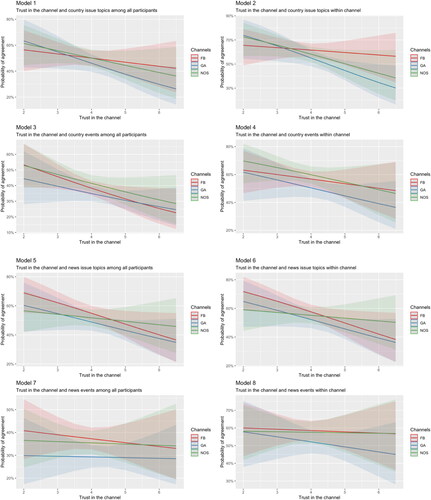
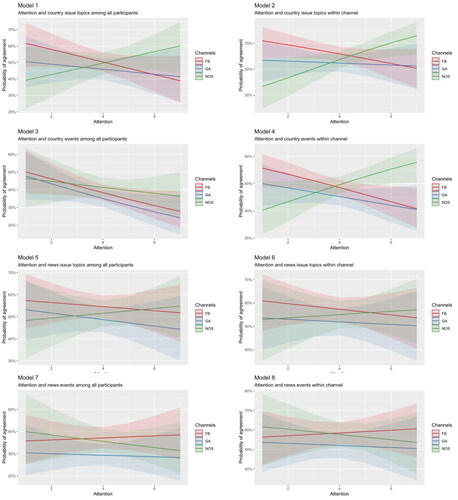
Figure 5. Estimated probabilities of attention to the news across models.Footnote4