
Figures & data
Figure 1. The experimental news website (originally displayed as a vertical 1 × 4 grid).

Figure 2. Interface nudges.
Note. From left: Popularity Nudge, Model Citizen nudge, Self-actualisation Nudge. Translation from left to right: “Most read”, 85% of readers find this important to know about’, and “Reading this article makes you become a better-informed citizen”.

Figure 3. Percentage of topics selected per nudge condition - aggregated (upper) & individual (lower).
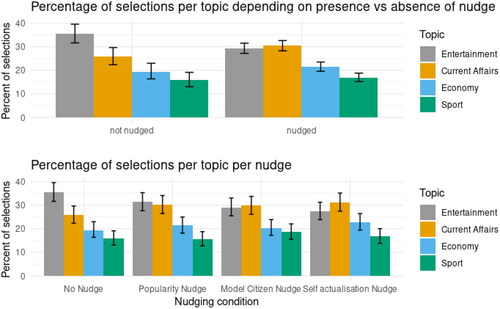
Table 1. Multilevel regression for H1a, H2a, and H3a with selection of current affairs news as binary dependent variable.
Table 2. Multilevel regression for H1b, H2b, and H3b with log-transformed reading time as continuous dependent variable.
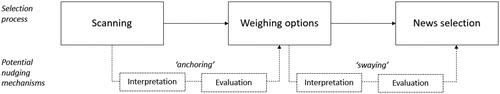
Figure 4. Nudging mechanisms that emerged during the qualitative interviews.
SUPPLEMENTARY_MATERIALS_Nudging_news_readers_clean version.docx
Download MS Word (204.7 KB)Data Availability Statement
The data underlying this article are available at https://osf.io/audh3/.