Figures & data
Figure 1. Functional expression of the KCNQ1 and HERG ion channel genes in hiPSC-CMs and rescue of JLNS hiPSC-CMs. (A) Induction kinetics of the KCNQ1 and HERG genes upon long-term culture of hiPSC-CMs. Spontaneous beating is first observed at ∼1 wk. 0 wk cells are undifferentiated hiPSCs. Data denote mean values ± SEM from independent experiments (qRT-PCR data). (B) Drug testing of ∼4 wk-old wild-type hiPSC-CMs on MEA chips using specific hERG (E4031) and KvLQT1 (C293B, chromanol 293B) inhibitors. Note that the T wave-like peak is reversibly shifted toward increased field potential (FP) durations upon addition of these molecules (representative MEA recordings). (C) Transgenic rescue of JLNS hiPSC-CMs using inducible KCNQ1 expression. Doxycycline (DOX) addition induces KCNQ1 leading to FPD shortening (representative MEA spectra).
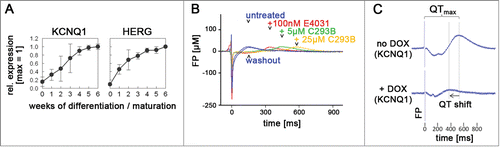
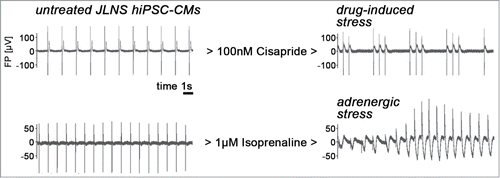
Figure 2. Stress-induced arrhythmia in JLNS hiPSC-CMs (representative MEA recordings). Left: Untreated cells beating spontaneously at a frequency of ∼0.5–1 Hz. Right: Administration of cisapride or isoprenaline induces arrhythmia in JLNS hiPSC-CMs. Note the torsade de point-like shape of the MEA spectrum under adrenergic stress conditions.