
Figures & data
Table I. Descriptive data and correlations of independent variables and age-adjusted death rates per 100,000 people.
Figure 1. Original (A) and reduced structural equation models (B) predicting MND death rates. Significant paths are solid lines. Prediction paths are straight arrows and covariances are curved double arrows.
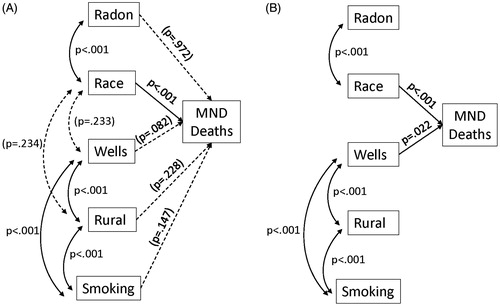
Table II. Standardized coefficients from structural equation models predicting MND death rates.