Figures & data
Figure 1. Kaplan–Meier survival curve for the whole population from which the study groups were derived.
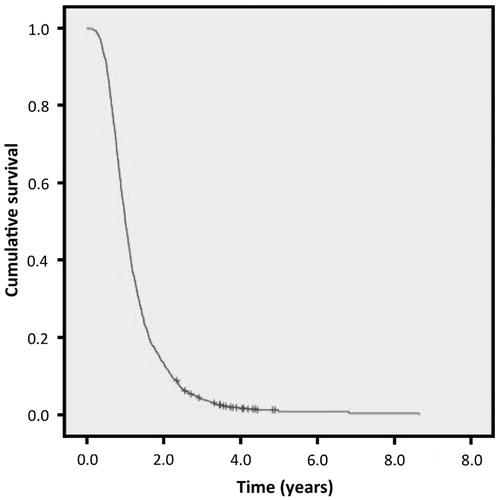
Figure 2. Visual representation of location of rare and common SNVs within UNC13A and associated LD plot. Intron/exon status and number of individuals in long/short survival groups given for rare SNVs.
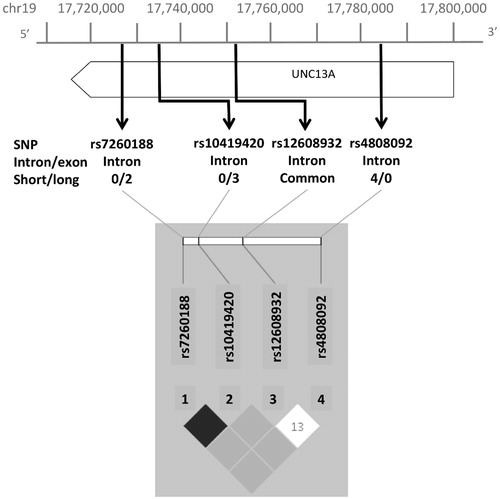
Table I. Demographic features of the long and short survival groups (UK cohort).
Table II. Linkage disequilibrium values for SNPs in UNC13A associated with extremes of survival in a UK population.
Table III. SNV minor allele frequency (MAF) for UK study population and 1000 Genomes Project.
Table IV. Genotype count data for variants of interest in UK discovery cohort.
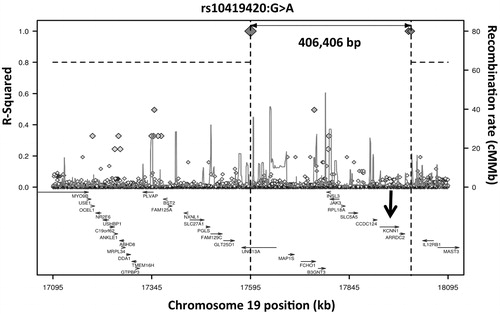
Figure 3. Long-range LD plot of UNC13A SNV rs10419420. The position of the KCNN1 gene, for which the common rs12608932 SNV in UNC13A acts as an eQTL, is shown with an arrow. Generated using SNP Annotation and Proxy Search (www.broadinstitute.org/mpg/snap/ldplot.php).