
Figures & data
Figure 1. Histograms showing changes in the ALSFRS-R score during 24-week treatment by patient (LOCF for patients who had completed at least the third cycle). (a) Full analysis set (FAS). The greatest changes in score in the placebo group (n = 99) and in the edaravone group (n = 100), respectively, were -26 and -28, while the smallest changes were +1 and +2. The median change in both groups was -4. The proportion of the patients with a decrease in the ALSFRS-R score of ≥12 points was 20.2% in the placebo group and 14.0% in the edaravone group. (b) dpEESP2y. The greatest changes in score in the placebo group (n = 29) and in the edaravone group (n = 39), respectively, were -26 and -13, while the smallest changes were 0 and +1. The median changes in the placebo and edaravone groups were -5 and -4, respectively. The proportion of patients with a decrease in the ALSFRS-R score of ≥12 points was 31.0% in the placebo group and 5.1% in the edaravone group. EESP = efficacy-expected sub-population of ALS patients (% forced vital capacity of ≥ 80% before treatment and ≥ 2 points for all items. dpEESP2y = subgroup of the EESP, containing patients with a diagnosis of ‘definite’ or ‘probable’ ALS according to the El Escorial revised Airlie House diagnostic criteria and with disease duration of ≤2 years. ALSFRS-R = revised ALS functional rating scale. ALS = amyotrophic lateral sclerosis. LOCF = Last observation carried forward.
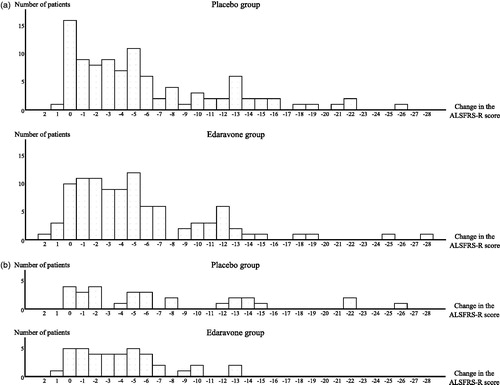
Table 1. Comparison of analysis groups.
Figure 2. Subgroups for analysis. EESP = efficacy-expected sub-population of ALS patients (% forced vital capacity of ≥80% before treatment and ≥2 points for all item scores in the ALSFRS-R before treatment). dpEESP2y = subgroup of the EESP, containing patients with a diagnosis of ‘definite’ or ‘probable’ ALS according to the El Escorial revised Airlie House diagnostic criteria and with disease duration of ≤2 years. Last observation carried forward was applied to patients who completed the third cycle. ALS = amyotrophic lateral sclerosis. ALSFRS-R = revised ALS functional rating scale.
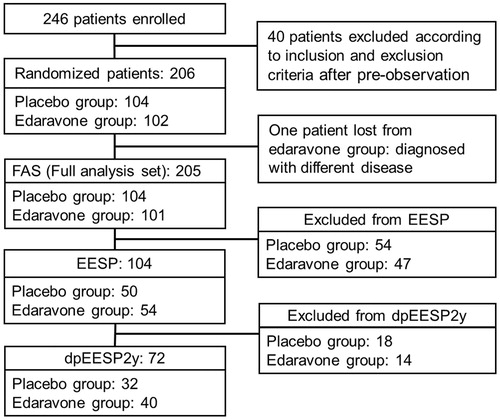
Table 2. Subject demographic characteristics.
Figure 3. Changes in the ALSFRS-R score during treatment in the FAS, EESP and dpEESP2y (LOCF for patients who had completed at least the third cycle). Least-squares mean ± standard error of the inter-group differences in the ALSFRS-R score during treatment were 0.65 ± 0.78 (p = 0.4108) in the FAS, 2.20 ± 1.03 (p = 0.0360) in the EESP and 3.01 ± 1.33 (p = 0.0270) in the dpEESP2y. FAS = full analysis set. EESP = efficacy-expected subpopulation of ALS patients (% forced vital capacity of ≥80% before treatment and ≥2 points for all item scores in ALSFRS-R before treatment). dpEESP2y = subgroup of the EESP, containing patients with a diagnosis of ‘definite’ or ‘probable’ ALS according to the El Escorial revised Airlie House diagnostic criteria and with disease duration of ≤2 years. ALSFRS-R = revised ALS functional rating scale. ALS = amyotrophic lateral sclerosis. LOCF = last observation carried forward.
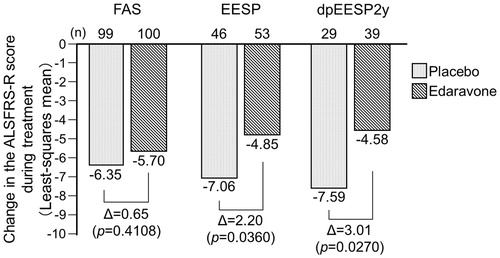
Figure 4. Changes in the secondary endpoints during treatment in the FAS, EESP and dpEESP2y (LOCF for patients who had completed at least the third cycle). (a) % forced vital capacity: Least-squares mean ± standard error of the inter-group differences in % forced vital capacity during treatment were 2.92 ± 2.24 (p = 0.1928) in the FAS, 4.62 ± 2.31 (p = 0.0488) in the EESP and 6.30 ± 3.10 (p = 0.0467) in the dpEESP2y. (b) Modified Norris Scale score. Least-squares mean ± standard error of the inter-group differences in Modified Norris Scale score during treatment were 2.03 ± 1.89 (p = 0.2835) in the FAS, 6.86 ± 2.74 (p = 0.0141) in the EESP and 7.95 ± 3.63 (p = 0.0326) in the dpEESP2y. (c) ALSAQ-40 score: Least-squares mean ± standard error of the inter-group differences in ALSAQ-40 score during treatment were 0.48 ± 3.50 (p = 0.8921) in the FAS, -2.51 ± 5.11 (p = 0.6244) in the EESP and -3.14 ± 6.76 (p = 0.6442) in the dpEESP2y. ALSAQ-40 = ALS assessment questionnaire (40 items). ALS = amyotrophic lateral sclerosis. FAS = full analysis set. EESP = efficacy-expected sub-population of ALS patients (% forced vital capacity of ≥80% before treatment and ≥2 points for all item scores in the ALSFRS-R before treatment). dpEESP2y = subgroup of the EESP, containing patients with a diagnosis of ‘definite’ or ‘probable’ ALS according to the El Escorial revised Airlie House diagnostic criteria and with disease duration of ≤2 years. LOCF = last observation carried forward.
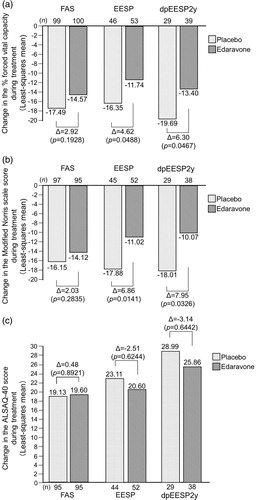
Table 3. Events of death or a specified state of disease progression in the FAS, EESP and dpEESP2y.
Table 4. Summary statistics of changes from baseline of the ALSFRS-R score in the FAS and subgroups (LOCF for patients who had completed at least the third cycle).
Table 5. Proportions of adverse events and serious adverse events in all randomized patients, the EESP and the dpEESP2y.