
Figures & data
Figure 1. Scores of dyspnea (A), orthopnoea (B), and respiratory insufficiency (C) above/at median versus below median percent predicted SVC.
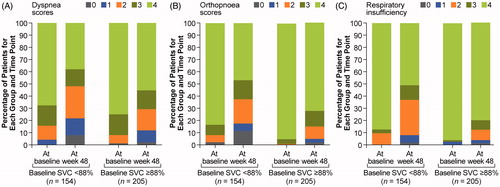
Figure 2. Respiratory insufficiency score 12 (A) or 10 (B): above/at median versus below median percent predicted SVC.
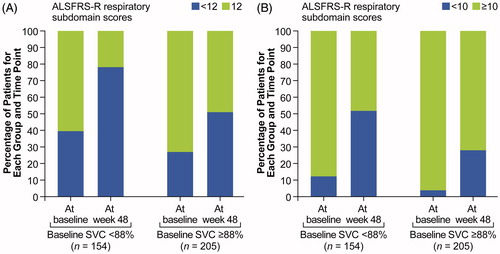
Figure 3. Correlation between percent predicted SVC and total ALSFRS-R score.
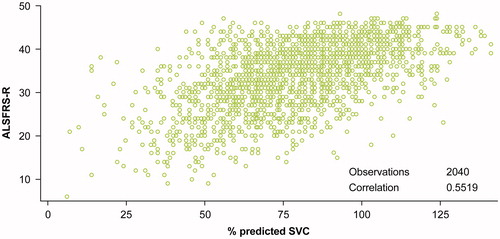
Figure 4. Relationship between change from baseline in SVC and changes in ALSFRS-R respiratory sub-score.
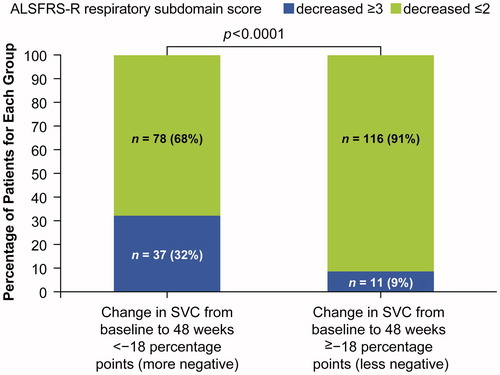
Table 1. Difference in percent predicted SVC at the first drop of ALSFRS-R dyspnea/orthopnoea score between patients with slow decline and rapid decline in SVC.