
Figures & data
Figure 1 Simplified, basic concepts concerning sampling frequency and ability to accurately measure the true slope of disease progression, assuming a linear decline over time. (A) Standard clinical trial design in which only intermittent assessments are obtained in any given patient. There is a great deal of uncertainty in the true rate of progression (see wide 95% confidence intervals). (B) Clinical trial design with frequency measurements. Although there continues to be noise in any individual measurement, by frequent sampling the uncertainty in the estimation of the true slope is much smaller.
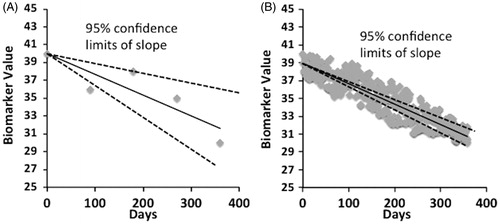
Figure 2 Overall set-up of ALS-at-home study across the 2 sites, Barrow Neurological Institute (BNI) and Beth Israel Deaconess Medical Center (BIDMC). BNI served as the main center for conducting the trial whereas BIDMC oversaw all the electronic-web infrastructure development and application.
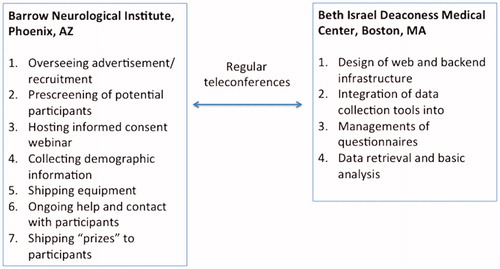
Figure 3 Diagram showing the complex interconnection between various components of the data acquisition system.
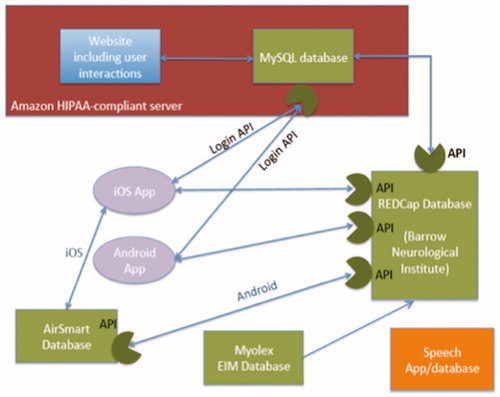
Figure 4 Patient experience from initial prescreening to the point of data collection.
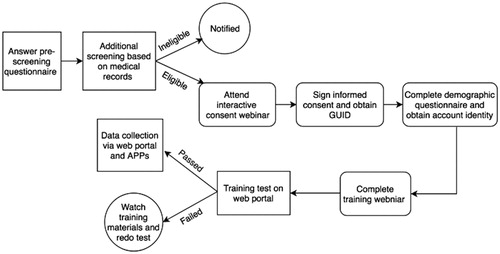
Figure 5 Geographic distribution of healthy and ALS participants.
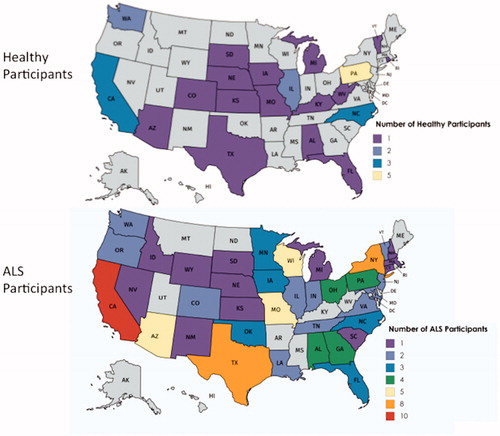
Table 1 Baseline data.