Figures & data
Figure 1 Demographics of participants included in the study. (A) The study consisted of 61 participants in total, with doctors (65.5%), nurses (9.1%), and allied health care professionals (25.5%) represented in the cohort. (B) There was an even distribution between those with less than 10 years’ experience working in ALS (50.8%) and those with 10 years’ or greater experience (48.2%).
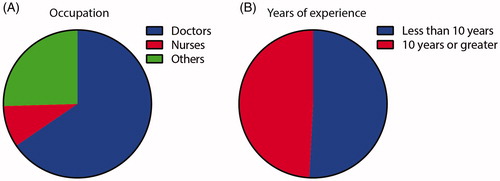
Figure 2 Use of a standard operating procedure leads to reliable clinical staging. Participants were trained in how to use the staging standard operating procedure (SOP, Supplementary Material), and most correctly staged case vignettes using the SOP. The numbers to the right of each bubble represent the number of answers within each group.
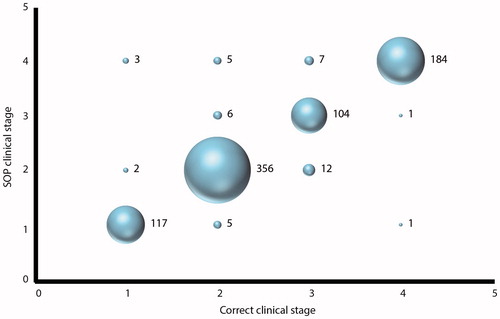
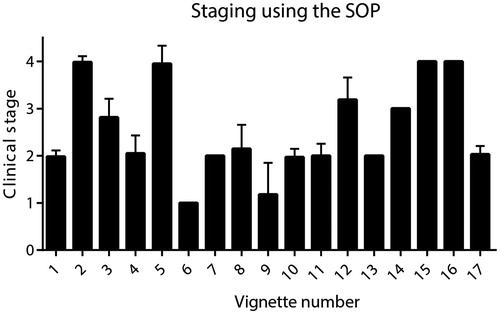
Figure 3 Variability of scores for staging using the SOP for each case vignette. Bars represent the mean and standard deviation of scores for staging using the SOP for each vignette. Variability in the answers was greatest for vignettes 8, 9, and 12.