Figures & data
Figure 1 Flowchart of participant enrollment and follow-up during the study period.
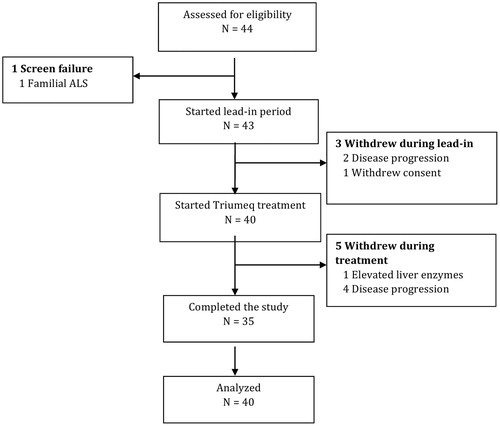
Table 1 Baseline characteristics of the cohort.
Table 2 Adverse events during study period.
Figure 2 Linear mixed models with time modelled as categorical variable (black). In grey are the 95% confidence intervals; the lead-in period is highlighted in green. The red line is a linear mixed model fitted on the lead-in data (solid) and extrapolated into the treatment period (dotted).
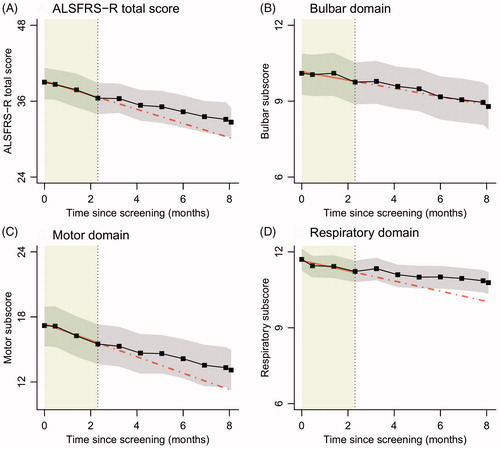
Figure 3 Linear mixed models with time modelled as categorical variable (black). In grey are the 95% confidence intervals; the lead-in period is highlighted in green.
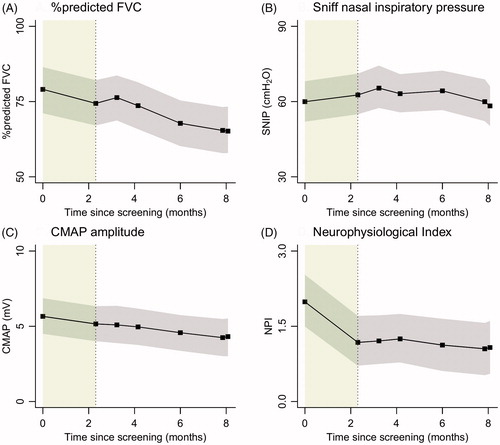
Figure 4 p75ECD at four time points. Treatment started at week 10.
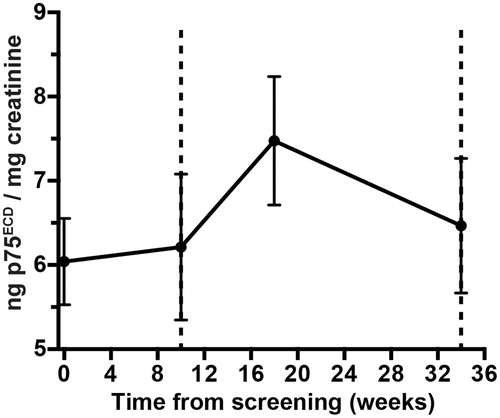
Figure 5 HERV-K DNA and RPP30 copy numbers were measured in all samples by digital PCR and the ratio of HERV-K/RPP30 was calculated as a measure of nongenomic HERV-K. (A) Absolute value of HERV-K DNA/RPP30 in untreated samples (N = 22) and at weeks 8 (W8; N = 15) and 24 of treatment (W24; N = 18) (Wilcoxon matched-pairs signed rank test). (B) The relative percent change of HERV-K/RPP30 at each follow-up visit (W8 and W24) compared to the HERV-K/RPP30 at the untreated visits (average of screening and baseline) was calculated (Wilcoxon signed rank test).
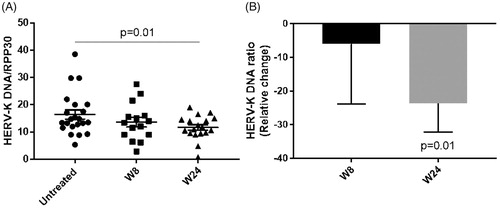
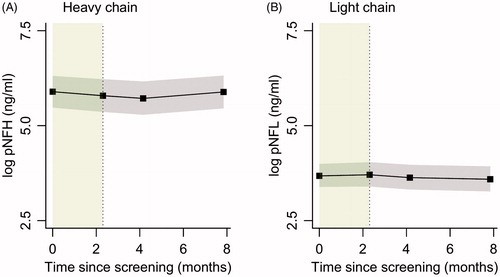
Figure 6 Linear mixed models with time modelled as categorical variable (black). In grey are the 95% confidence intervals; the lead-in period is highlighted in green. Plasma concentrations were log-transformed (natural) due to right-side skewness.