Figures & data
Figure 1 Disagreement in %predicted FVC between reference standards at baseline. For each patient, we calculated the maximal difference in %predicted FVC between two reference standards as measure of disagreement. The median %predicted is the median value of the five reference standards.
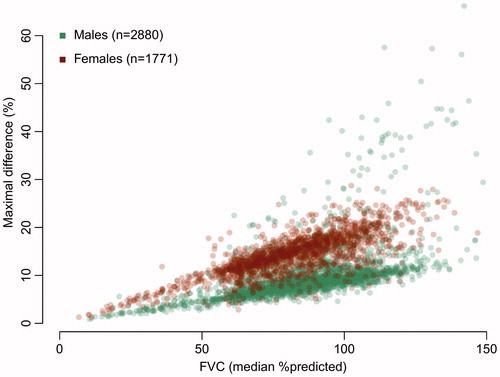
Table 1 Characteristics of patients at baseline.
Figure 2 Quantile-Quantile plots of the different reference standards. (a–d) Quantile-Quantile plots of each reference standard with the GLI as reference distribution. Ideally, two reference standards would provide similar estimates, resulting in a straight line (dashed-line). The colors represent the deviation from the ideal line (green less than 2.5% deviation, red more than 25% deviation). (e) Cumulative proportions of patients below FVC cutoff values in PRO-ACT.
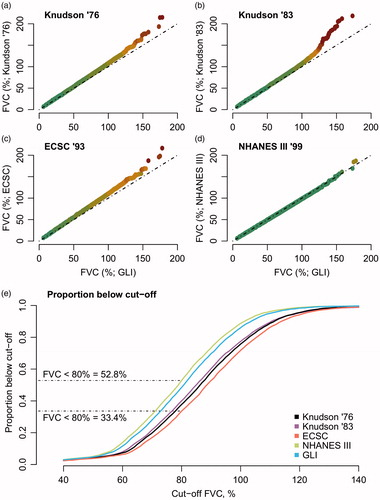
Table 2 Multivariate Cox proportional hazard models per reference standard.
Table 3 Longitudinal linear mixed models per reference standard.
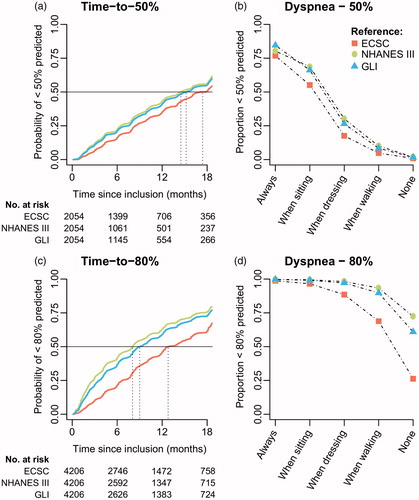
Figure 3 Kaplan–Meier curves of referral criteria and the association with symptoms of dyspnea. (a + c) Time-to-50% or 80% is defined as the time from trial inclusion to the first FVC measurement below 50% or 80% predicted, estimated in those patients whose FVC was higher than 50% or 80% at inclusion (N = 4,206 and N = 2,054, respectively). (b + d) Generalized linear mixed-effects model (logistic) with FVC dichotomized (<50% vs. ≥50% or <80% vs. ≥80%) as function of ALSFRS item 10 (Dyspnea) in 4,528 patients with 32,955 matched ALSFRS – FVC data points. Overall, results for Knudson ’76 & ’83 were similar to the ECSC (results not shown).