
Figures & data
Table 1 Population characteristics.
Figure 1 Spline plot showing the non-linear relationship between nail mercury levels and ALS risk. (A) Log odds of ALS plotted by nail mercury (log10(µg/g) adjusted for age and smoking. (B) Odds ratios for ALS risk associated by nail mercury (log10(µg/g).
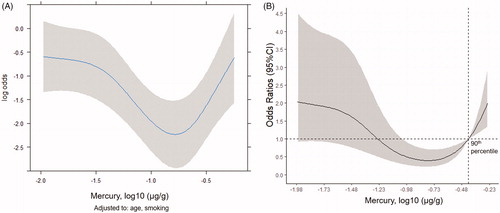
Table 2 Logistic regression odds ratios for ALS risk by nail Hg level calculated from spline model.
Table 3 ALS risk associated with categorized nail Hg levels.
Table 4 Factors associated with high nail Hg levels in controls.
Supplemental material