
Figures & data
Table 1 People with ALS (PALS) and caregiver demographics.
Figure 1 Comparison of perceived symptoms by people with ALS (PALS), current caregivers (C-LPALS), and prior caregivers (C-DPALS) over the last 2 weeks. *C-DPALS were asked to report perceived symptoms over the last 2 weeks of the patient’s life
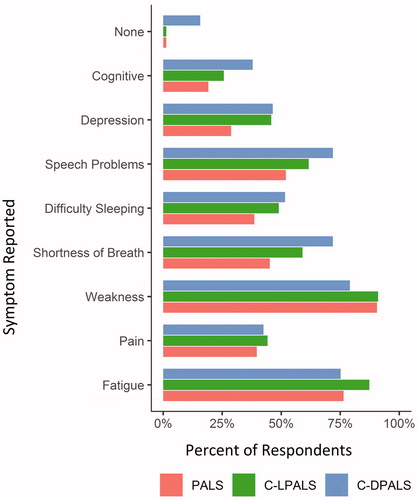
Table 2 Percent of people with ALS (PALS) with given symptom in the preceding 2 weeks as reported by PALS and current caregivers (C-LPALS).
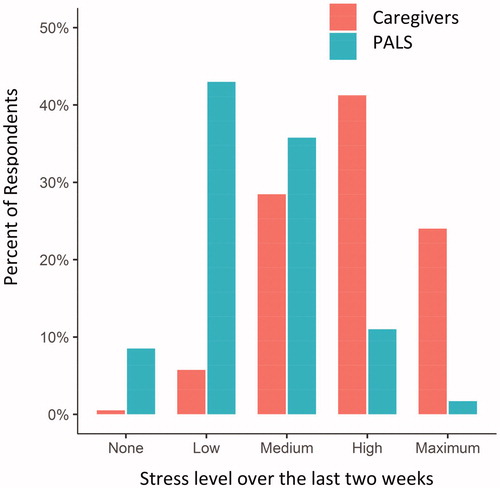
Figure 2 Self-reporting of stress level over the last 2 weeks from people with ALS (PALS) and caregivers (C-LPALS and C-DPALS).
Supplemental material