Figures & data
Figure 1. Study profile.
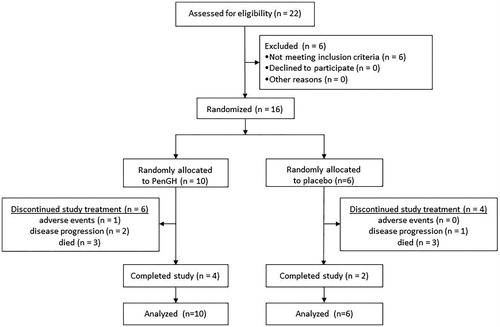
Table 1. Baseline characteristics.
Figure 2. Individual changes in ALSFRS-R total score since randomization. Individual patient ALSFRS-R total scores (y-axis) over time since randomization in months (x-axis). Prognosis is based on the ENCALS survival model (Citation11).
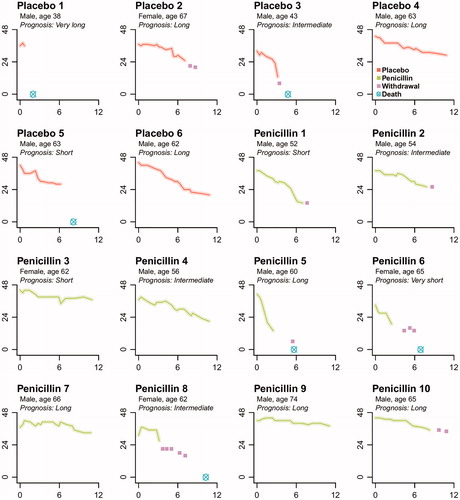
Table 2. Primary and secondary efficacy endpoints.
Table 3. Safety profile.
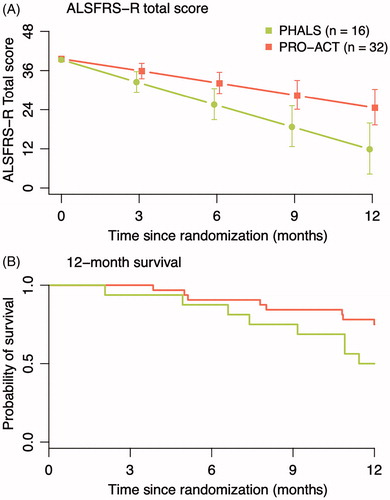
Figure 3. Propensity matched analysis of PHALS vs. PRO-ACT. Patients were matched 1:2 with placebo patients in the PRO-ACT cohort. The matched sample from PRO-ACT consisted of eligible patients for the PHALS criteria and complete data on all prognostic variables (N = 302). In the matched analysis, the mean difference in ALSFRS-R decline between PHALS and PRO-ACT was −1.03 points per month (−1.72 to −0.37, p = 0.003).