Figures & data
Table 1 Demographics for patients used in correlations ().
Table 2 Demographics for patients used in repeated measures regression model.
Table 3 Regression models.
Figure 1 As ALSFRS-R score worsens, serum IL6 increases; this relationship exists for all patients but is more predictable across those with the C allele. (A) Patients who have lost over half the possible points on the ALSFRS-R scale on average have double the serum IL6 as someone who has lost less than a quarter of the available points (“<24” vs “36–48” *p < 0.001; student’s t-test); mean values left to right (n#): 2.75 (136), 3.82 (89), 5.29 (45), 5.94 (25). (B) Scatterplot of data tested. (C) The elevation in serum IL6 with worsening (decreasing) ALSFRS score is maintained more consistently for individuals with the C allele at worsened scores. Mean values from left to right (n#) for *C: 2.88 (77), 3.91 (54), 5.21 (32), 6.18 (21). Mean values from left to right (n#) for AA: 2.59 (59), 3.68 (35), 5.49 (13), 4.69 (4); Spearman correlations: all patients rho= −0.2968, p < 0.0001; *C rho= −0.3093, p < 0.0001; AA rho= −0.2612, p = 0.0056.
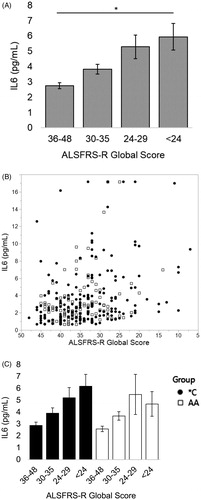
Figure 2 When ppFVC > 55% (before severe respiratory insufficiency), as ALSFRS-R limb subscore worsens, serum IL6 increases. When divided by presence of the C allele, this relationship is only significant for *C patients. (A) Patients who have lost over half the possible limb subscore points on the ALSFRS-R scale on average have nearly double the serum IL6 as someone who has lost less than a quarter of the available points (“<13” vs “19–24” *p < 0.001, student’s t-test); mean values from left to right (n#): 2.53 (63), 3.15 (81), 4.80 (45). (B) Scatterplot of analyzed data. (C) The elevation in serum IL6 with worsening (decreasing) ALSFRS limb subscore for is apparent for individuals with the C allele with a doubling of the average serum IL6 after a patient is at or below the half-of-normal ALSFRS-R limb subscore (“19–24” vs “13–18” and “19–24” vs “<13” *p < 0.001, student’s t-test). Mean values from left to right (n #) for *C: 2.73 (45), 3.14 (45), 6.08 (25). Mean values from left to right (n #) for AA: 2.02 (18), 3.17 (36), 3.19 (20). Spearman correlations: all patients rho= −0.3251, p < 0.0001; *C rho= −0.3679, p < 0.0001; AA p = 0.0567.
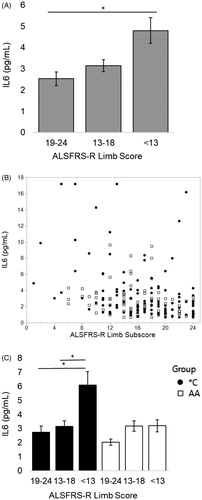
Figure 3 When ppFVC ≤ 55% (severe respiratory insufficiency), as ALSFRS-R respiratory subscore worsens, serum IL6 increases. When divided by presence of the C allele, this relationship is only significant for *C patients. (A) Patients who have lost at least 1/3 of the points on the respiratory subscale (“<8”) have a 31% increase in their serum IL6 from patients with little to no subjective respiratory impairment (“11–12”). Mean values from left to right (n#): 3.35 (19), 4.38 (42), 4.87 (29). (B) Scatterplot of analyzed data. (C) Patients with the C allele who have lost at least 1/3 of the points on the respiratory subscale have an average 45% increase in their serum IL6 from patients with little to no subjective respiratory impairment (“<8” vs “11–12” *p = 0.05, student’s t-test). Mean values from left to right (n#) for *C: 2.84 (10), 4.67 (19), 5.17 (32). Mean values from left to right (n#) for AA: 4.46 (16), 3.94 (4), 3.71 (9). Spearman correlations: all patients rho= −0.3060, p = 0.0034; *C rho= −0.3114, p = 0.0146; AA p = 0.141.
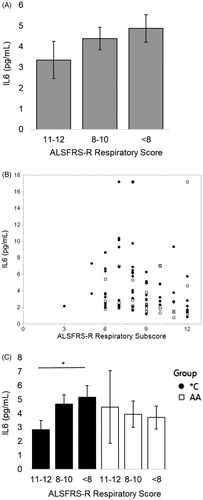
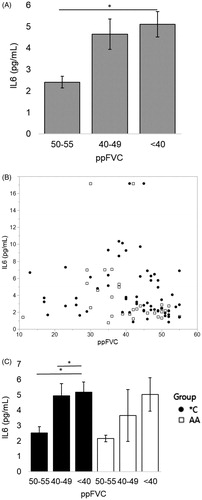
Figure 4 After ppFVC ≤ 55%, IL6 increases with lower values of ppFVC. When divided by presence of the C allele, this relationship is significant only for *C patients. (A) On average, patients have over 100% increase in serum IL6 when 10–15 percentage points are lost from ppFVC after reaching ppFVC ≤ 55% (“<40” vs “50–55” *p < 0.01, student’s t-test). Mean values from left to right (n#): 2.41 (21), 4.64 (37), 5.11 (33). (B) Scatterplot of analyzed data. (C) The elevation in serum IL6 with worsening (decreasing) ppFVC is maintained significantly for patients with the C allele; those *C individuals have a significant increase in IL6 just after reaching severe respiratory failure (“50–55” vs “40–50” and “50–55” vs “<40” *p < 0.05). Mean values from left to right (n#) for *C: 2.54 (14), 4.96 (28), 5.17 (19). Mean values from left to right (n#) for AA: 2.17 (7), 3.66 (9), 5.03 (14). Spearman correlations: all patients rho= −0.3082, p = 0.0030; *C rho= −0.3119, p = 0.0144; AA p = 0.070.