
Figures & data
Table 1 Characteristics of cohort participants.
Table 2 Hazard ratios (HRs) and 95% confidence intervals (CIs) of amyotrophic lateral sclerosis (ALS) among individuals with a gastrointestinal (GI) biopsy result of normal mucosa, compared to matched individuals without any gastrointestinal biopsy.
Table 3 Hazard ratios (HRs) and 95% confidence intervals (CIs) of amyotrophic lateral sclerosis (ALS) among individuals with a gastrointestinal (GI) biopsy result of non-specific inflammation, compared to matched individuals without any gastrointestinal biopsy.
Figure 1 Kaplan-Meier plots of the probability of surviving patients relative to years since ALS diagnosis; Left figure, individuals with a biopsy result of normal mucosa (green dashed line) and their matched controls (p for log-rank test = 0.9768); Right figure, individuals with a biopsy result of non-specific inflammation (blue dashed line) and their matched controls (p for log-rank test = 0.9604).
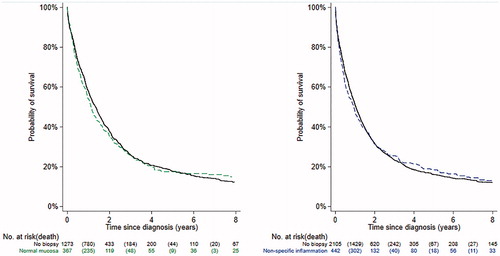
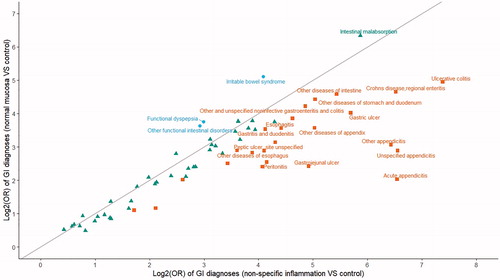
Figure 2 Scatter plot of log2 transformed odds ratios (ORs) of gastrointestinal related diagnoses during the 5 years prior to the first biopsy (individuals with GI biopsy) or date of selection date (population controls). ORs were calculated from conditional logistic regression model, and p-values for all ORs were less than 0.05. Blue circles denote ORs that are greater for normal mucosa than non-specific inflammation. Green triangles denote ORs that are similar between normal mucosa and non-specific inflammation. Brown squares denote ORs that are smaller for normal mucosa than non-specific inflammation.
Supplemental Material
Download MS Word (14.4 KB)Data availability statement
Due to legal and ethical reasons, the data cannot be shared.