
Figures & data
Figure 1 Gut microbiome profiles did not differ between the males (n = 10) and females (n = 10) of the healthy volunteer group, as assessed by permutational analysis of variance (p = 0.4). PCoA: Principal coordinate analysis.
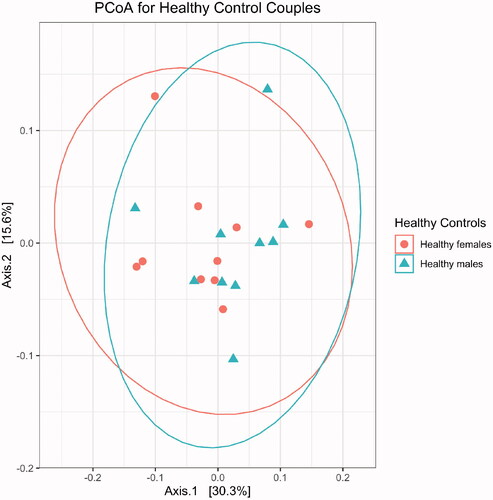
Figure 2 Gut microbiome profiles were different between ALS patients (n = 9) and their spouses (n = 9), as assessed by permutational analysis of variance (p = 0.003).
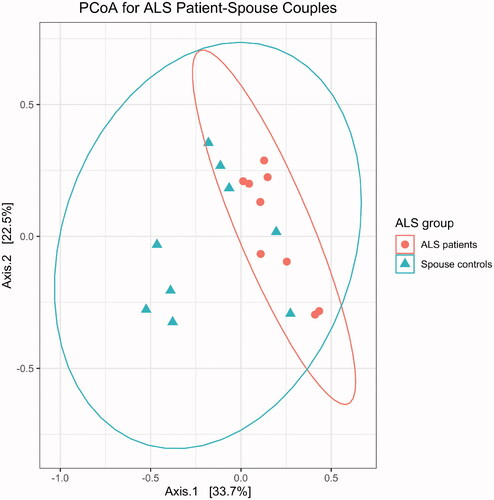
Figure 3 ALS patient (n = 9) gut microbiomes were more diverse than those of their spouses (n = 9) with respect to species richness (p = 0.03) and species evenness (p = 0.004), which were measured using the Chao1 and Shannon indices, respectively.
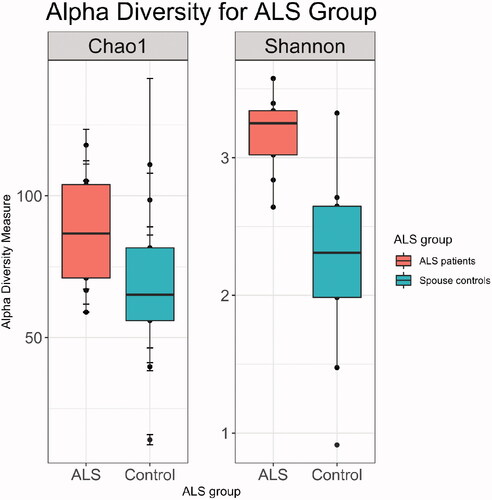
Figure 4 ALS patients (n = 9) were deficient in Prevotella spp. compared with their spouses (n = 9; p = 0.02).
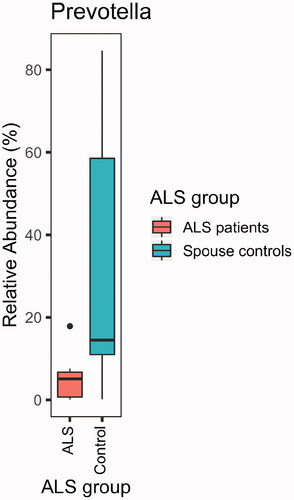
Figure 5 ALS patients (n = 9) were deficient in P. timonensis compared with their spouses (n = 9; p = 0.04; sign test).
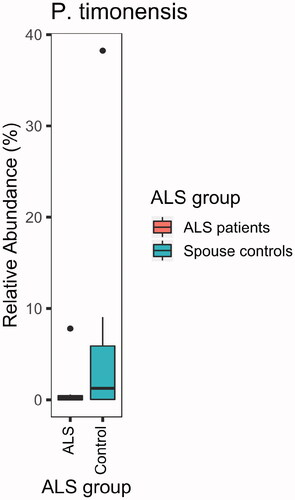
Table 1. Average (Avg.) and standard deviation (SD) values of inflammatory biomarkers in plasma and stool for ALS patients as well as for partner/caregiver controls, and the average and standard deviation of the difference between patient and control.
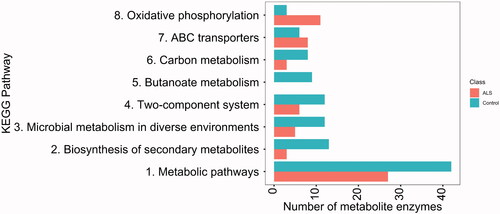
Figure 6 KEGG pathway analysis revealed a differential abundance of enzymes in ALS patients (upper bar) and their spouses (lower bar).
Supplemental Material
Download MS Word (358.7 KB)Data availability statement
The 16S sequence data have been deposited in the National Center for Biotechnology Information (NCBI) database on BioProject accession number PRJNA566436. Sample metadata are maintained at dx.doi.org/10.15139/S3/84SGKO.
Code for processing and analyses are maintained at dx.doi.org/10.15139/53/845GKO.