
Figures & data
Table 1 Patient characteristics by clinical phenotype at onset.
Figure 1 Median delay times grouped by clinical phenotype at onset. Displayed as three components: from onset to initial health care visit (blue), from initial health care visit until referral to a specialist ALS clinic (yellow), and from initial health care visit to ALS diagnosis (green). The first component being the patients’ delay and the second and third comprising the doctors’ delay. Reported as median time in months with the 25th–75th percentile in parentheses.
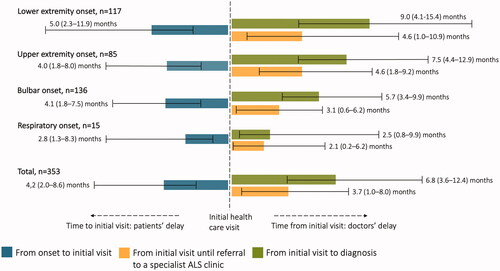
Table 2 Predictors of longer time to diagnosis.
Figure 2 (A–D) Patient path during the first investigation cycle. Shown separately for each of the four onset phenotype groups. The yellow arrows indicate the proportion of patients where there was involvement of additional health care providers other than that of the first health care visit. Many patients were referred to more than one additional health care provider during the course of the investigation cycle and therefore the sum of percentages in the box might exceed 100%. A substantial proportion of patients were admitted to hospital for inpatient care as part of the investigation cycle. This proportionis included in the box showing additional health care providers. The proportion of patients referred directly or indirectly to a specialist ALS clinic is shown in green and the proportion receiving an alternate or no diagnosis is shown in red. Only additional health care providers and diagnoses >3% and n > 1 are shown, except in the respiratory onset group were all are shown due to low number of patients. COPD: chronic obstructive pulmonary disease; ED: emergency department; ENT: ear, nose, and throat; HCP: health care provider; PCP: primary care provider.
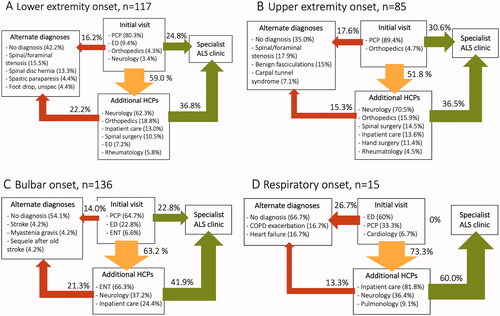
Figure 3 (A–D) Symptom spread at the initial health care visit versus at diagnosis. Showing the percentage of patients with symptoms from a particular area (from top to bottom: speech, cognition, swallowing, breathing, right arm, left arm, right leg, left leg), separately for each of the four onset phenotype groups. Of note, the graphic presentation is a result of pooled data at group level and fails to illustrate the asymmetrical spread of ALS symptoms in individual patients.
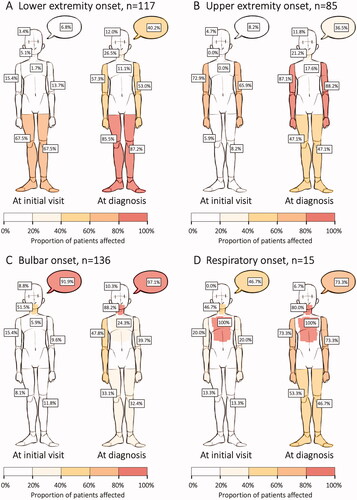
Table 3 King’s stage at the initial health care visit versus at diagnosis.
Supplemental Material
Download MS Word (18.8 KB)Data availability statement
The study is partly based on data from the Swedish MND Quality Registry. Having obtained the appropriate approval from a research ethics board, these data can be accessed from the registry office upon request.