
Figures & data
Figure 1 Recruitment and enrollment into StAR4.
This figure displays enrollment of the “ALS Reversals” group participants. We had previously attempted to contact the authors of the cases identified in the literature but the authors were either non-contactable or the case in question was lost to follow-up. The individual excluded per protocol did not speak English to the extent necessary to complete this survey accurately.
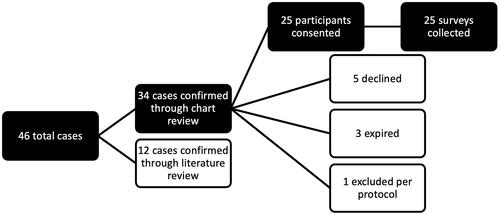
Table 1 Demographics.
Figure 2 Vigorous exercise by decade.
This figure depicts the percent of participants endorsing engaging in vigorous exercise during different decades of life. The small n of the “ALS Reversals” group limits interpretation, but the overall response appears similar visually. There does not appear to be substantial difference between comparison groups.
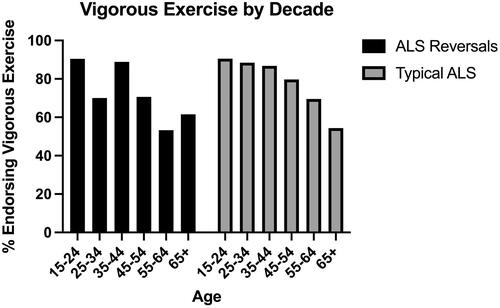
Figure 3 BMI at age 40 years.
This figure depicts the distribution of BMI descriptors at age 40. There was no clear difference in BMI descriptors between participant groups (p = 0.257).
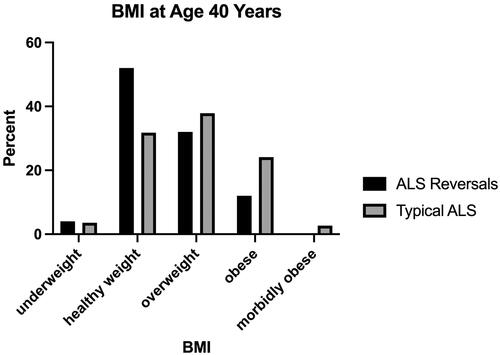
Figure 4 Percent of participants consuming caffeinated beverages.
This figure depicts the percent of participants endorsing regular caffeinated beverage consumption for at least six months during adulthood. The distribution was very similar visually between participant groups.
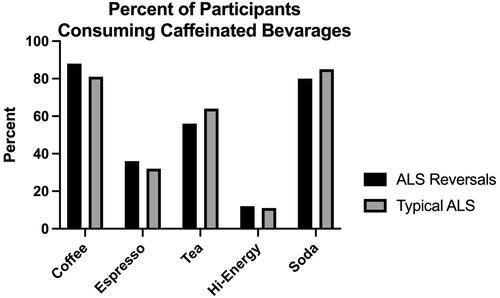
Table 2 Longest held job.
Table 3 Longest NAICS industry.
Table 4 Occupational exposures.
Table 5 Hobby & recreational exposures.
Table 6 Home exposures.