
Figures & data
Figure 1 Participant flow diagram for the PatientsLikeMe database.
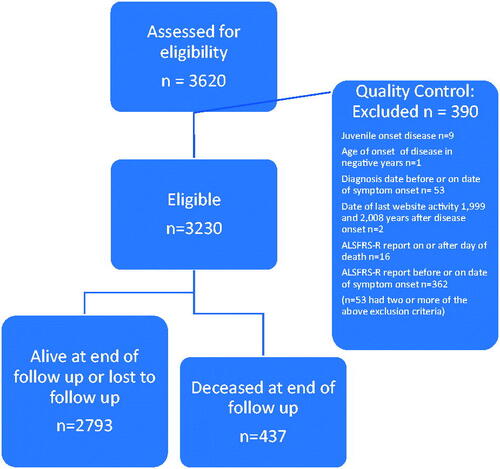
Table 1 Baseline characteristics King’s College Hospital (KCH), LiCALS and MitoTarget, PatientsLikeMe and PRO-ACT databases with values expressed as Mean (95% Confidence Interval) or Number (% of total).
Figure 2 Box plot of standardized times to each stage in all 3,026 deceased patients from the five databases (KCH, PatientsLikeMe, LiCALS, MitoTarget and PRO-ACT) using every milestone reached.
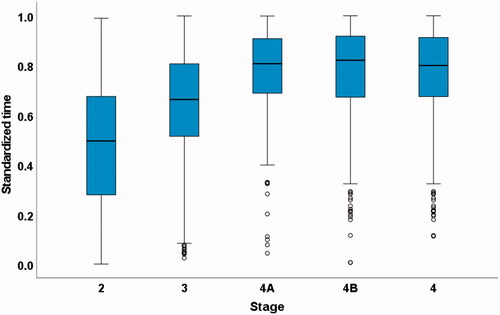
Figure 3 Box plot of standardized times to each stage in the 1,959 deceased patients from PatientsLikeMe, LiCALS, MitoTarget and PRO-ACT databases using every milestone reached.
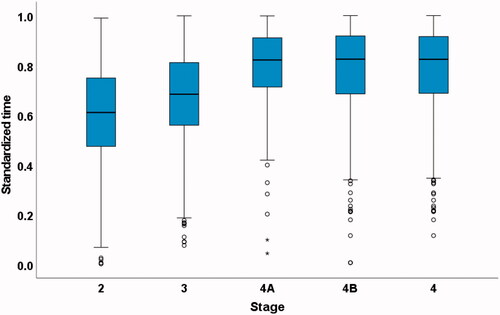
Table 2 Standardized times to every milestone reached and milestone timings for King’s College Hospital (KCH), PatientsLikeMe, LiCALS, MitoTarget and PRO-ACT databases.
Table 3 Standardized times in PatientsLikeMe, LiCALS, MitoTarget and PRO-ACT databases in limb onset versus bulbar onset patients.