Figures & data
Figure 1 NST002 Study participant flowchart. Participants’ disposition in an open-label 12 months of dosing study.
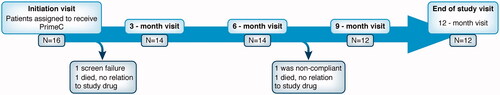
Figure 2 Survival of patients in clinical trial population compared to survival prediction models. For each patient, the probability to survive 12 months was calculated according to the Origent and ENCALS survival prediction models. Patients were subsequently ranked from low to high according to their predicted survival probability, with a low rank reflecting a poor survival probability. Both models were in agreement that both deaths occurred in the lower quartile of the population at high risk for death.
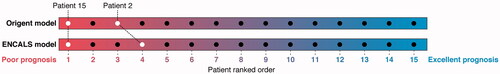
Table 1 Patient characteristics at baseline.
Table 2 Overview of adverse events.
Table 3 Propensity matching (1:2) with PRO-ACT.
Table 4 Rate of decline PrimeC vs. PRO-ACT.
Figure 3 ALS-pathology related NDE biomarker levels in ALS vs. control samples. Wilcox test comparing neural-derived blood exosomal biomarkers: TDP-43 (A) and LC3 (B) between patients with ALS and healthy volunteers (N = 35 for ALS and 25 for control per group) as obtained in a baseline study.
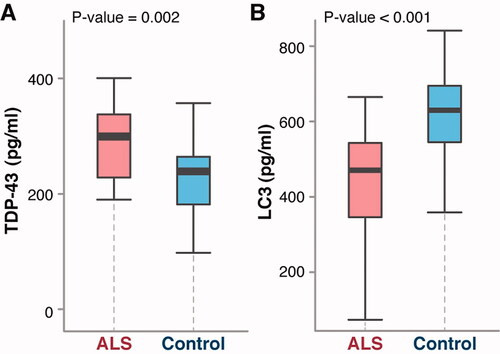
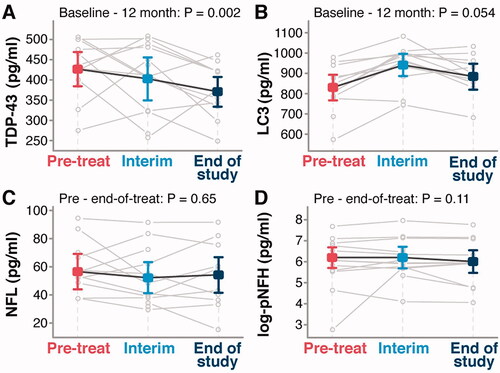
Figure 4 ALS-pathology related biomarker levels in PrimeC treated ALS patients over time. (A,B) Average ALS-pathology related serum NDE marker levels over time (pre in red, interim in light blue, and end of study in dark blue). (A) TDP-43 levels. (B) LC3 levels. (C,D) Average serum NFL (C) and pNFH (D) over time (pre in red, interim in light blue, and end of study in dark blue). P values tests whether the means at pre-treat are similar compared to the mean at end-of-treat, based on a mixed model for repeated measures.