
Figures & data
Table 1 Participant characteristics (N = 57).
Figure 1 Percent of critiques by item in response to the question, ‘Can you think of a situation where you might not be able to answer this item accurately or that your answer might not reflect your abilities?’ Percentage is out of the total number of participants who responded to any question in this section (n = 57).
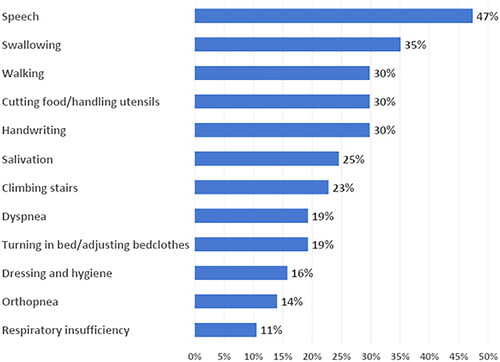
Table 2 Contextual themes by item based on qualitative responses.
Supplemental material
Supplemental Material
Download MS Excel (30.8 KB)Data availability statement
The subset of the data that support the findings of this study have been included in a Supplemental file.