
Figures & data
Table 1 Baseline characteristics.
Table 2 MiToS stage at baseline.
Table 3 King’s stage at baseline.
Table 4 Days of maintaining the baseline MiToS or King’s stage in the FORTITUDE-ALS trial.
Figure 1 Time to decline of ≥1 MiToS stage from baseline. p-Value from log-rank test at week 12 (end of the double-blind treatment period).
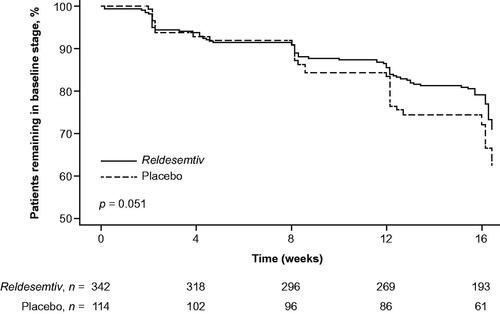
Table 5 Progression from baseline to a later stage using MiToS or King’s staging.
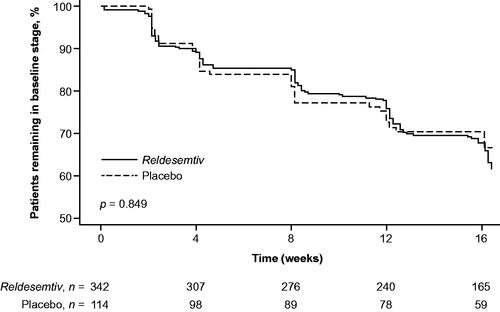
Figure 2 Time to decline of ≥1 King’s stage from baseline. p-Value from log-rank test at week 12 (end of the double-blind treatment period).
Data availability statement
Data reported herein are part of a sponsor-led clinical development program that is ongoing, and thus complete datasets for the trial will not be made available with this report.