
Figures & data
Table 1 Sociodemographic and clinical features of the sample.
Table 2 Neuropsychological assessment of the sample.
Table 3 Reference data and cutoffs for the verbal fluency index (Vfi) in each subgroup of healthy controls.
Figure 1 Application of VFT and Vfi cutoffs. Graphs display the percentages of ALS patients with an impaired and normal performance applying VFT and Vfi cutoffs. p Value refers to Fisher’s exact test.
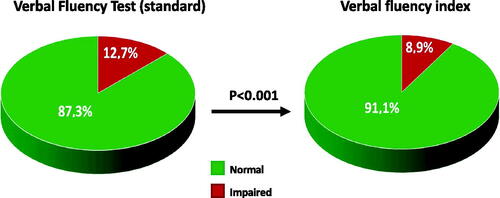
Figure 2 Significant relationships between patients’ verbal fluency test and verbal fluency index performances with their white matter tract integrity. Abbreviations: CC: corpus callosum; CC-SMA: callosal fibers linking the supplementary motor area; CST: corticospinal tract; L: left; R: right; SLF: superior longitudinal fasciculus.
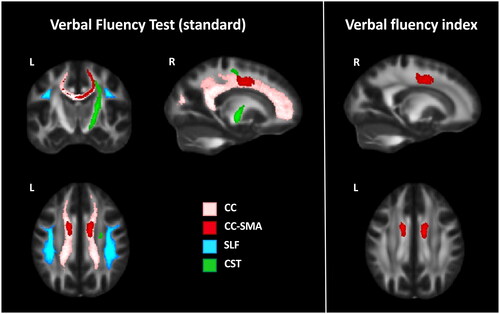
Table 4 Significant relationships between patients’ verbal fluency test and verbal fluency index performances and their white matter tract integrity.
Supplemental Material
Download MS Power Point (88.8 KB)Supplemental Material
Download MS Word (18.2 KB)Supplemental Material
Download MS Word (31 KB)Supplemental Material
Download MS Word (51.3 KB)Data availability statement
The dataset used during the study will be made available by the corresponding author upon request to qualified researchers (i.e. affiliated with a university or research institution/hospital).