
Figures & data
Table 1 Patient characteristics, shown separately for those with a low versus high motor symptom burden.
Table 2 Characteristics of 13 ALS patients with longitudinal FDG-PET imaging.
Figure 1 (A–B) General pattern of brain metabolic alterations on FDG-PET imaging in ALS. Distribution of brain metabolic alterations in 66 ALS patients with a low motor symptom burden (A) and 65 ALS patients with a high motor symptom burden (B), compared to a cohort of 39 healthy controls. Blue indicates areas of relative hypometabolism, and orange indicates areas of relative hypermetabolism (difference only appreciable in color version). FDG-PET: fluorodeoxyglucose-positron emission tomography; L: left; R: right.
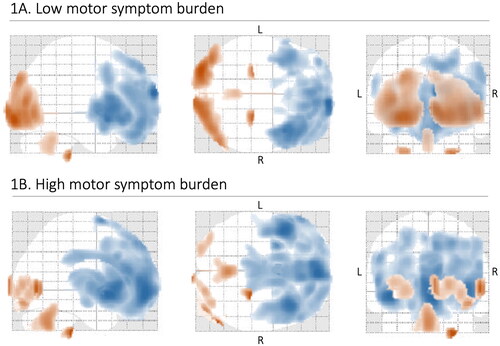
Table 3 Brain anatomical areas with significant metabolic alterations on FDG-PET imaging in 131 patients with ALS compared to healthy controls, shown separately for those with a low versus high motor symptom burden.
Right
Figure 2 (A–B) Brain metabolic alterations on FDG-PET imaging in relation to focal weakness in ALS. Including focal weakness with and without upper motor neuron (UMN) signs (A) and only including focal weakness with concomitant UMN signs (B). Blue indicates areas of relative hypometabolism, and orange indicates relative hypermetabolism (difference only appreciable in color version). Regions that were not associated with specific alterations are shown to the left in both A and B and the regions that were associated with specific alterations (bulbar and right lower extremity, respectively) are shown to the right. The bulbar region was not included in B since UMN signs in this area are difficult to appreciate on clinical examination. FDG-PET: fluorodeoxyglucose-positron emission tomography; L: left; R: right.
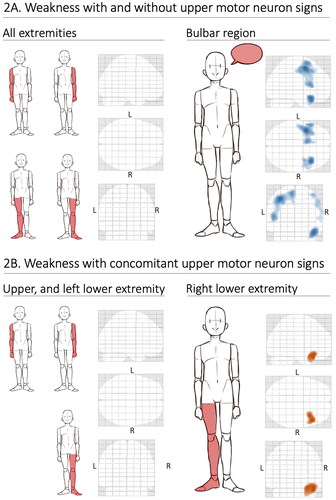
Table 4 Brain anatomical areas with significant metabolic alterations on FDG-PET imaging in relation to focal motor weakness in 131 patients with ALS.
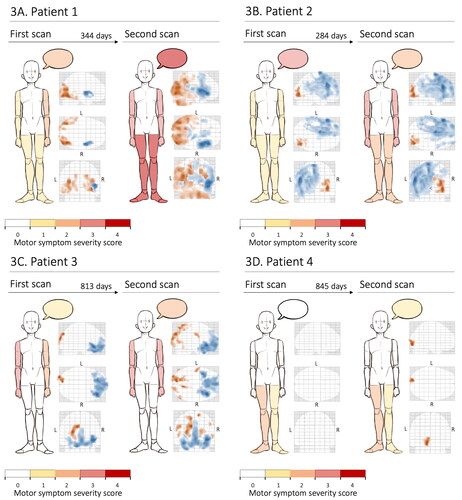
Figure 3 (A–D) Examples of brain metabolic alterations on longitudinal FDG-PET imaging in four patients with ALS. Compared to a cohort of 39 healthy controls. The findings are shown in relation to the severity of motor weakness, indicated by a color scheme, in several areas: right upper extremity, left upper extremity, right lower extremity, left lower extremity, and the bulbar region (represented by a speech bubble). In the FDG-PET imaging illustrations, blue indicates areas of relative hypometabolism whereas orange indicates relative hypermetabolism (difference only appreciable in color version). FDG-PET: fluorodeoxyglucose-positron emission tomography; L: left; R: right.
Supplemental Material
Download PDF (122.4 KB)Data availability statement
Data on patient characteristics and imaging can be obtained from the original data sources or from the authors with the appropriate approval from a research ethics board.