Figures & data
Figure 1 Trial setup. Patient (left image) sitting in front of a computer screen, with a standard webcam (right image, 1) placed on top. Different tasks are presented on-screen using a moving dot as a visual stimulus (2). During the tasks, oculometric measures extraction and eye movement analysis are presented in the operator’s screen (Citation3).
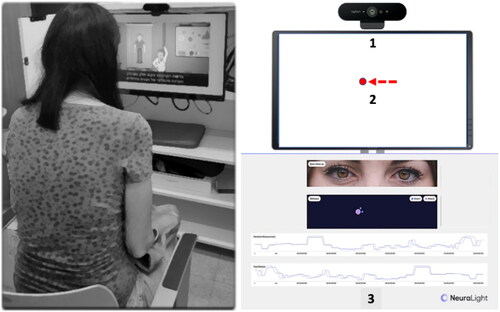
Figure 2 Correlation between ALSFRS-R scores and corrective saccadic latency (ms; R = 0.52, p = 0.002, y = 2.2x + 22.07). Each dot represents a single patient.
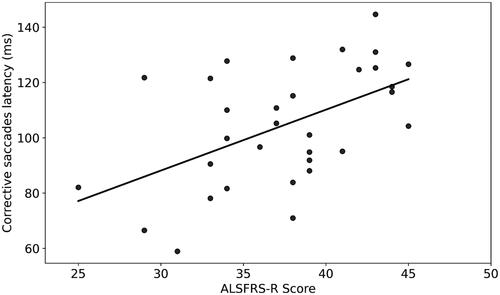
Figure 3 Fixation time (in ms) during smooth pursuit tasks of ALS patients (left) versus healthy subjects (right, p = 0.01).
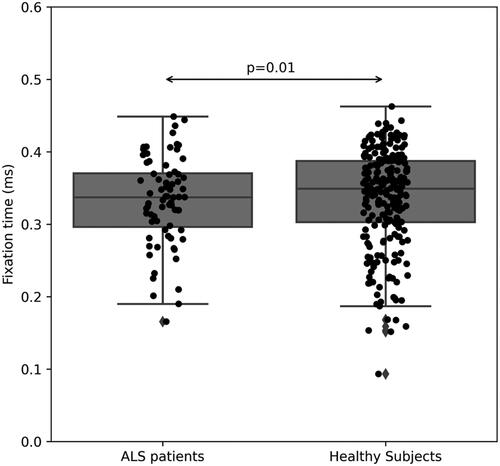
Figure 4 Peak velocity (degree/ms) in pro-saccade eye movement of ALS patients (left) versus healthy subjects (right, p = 0.04).
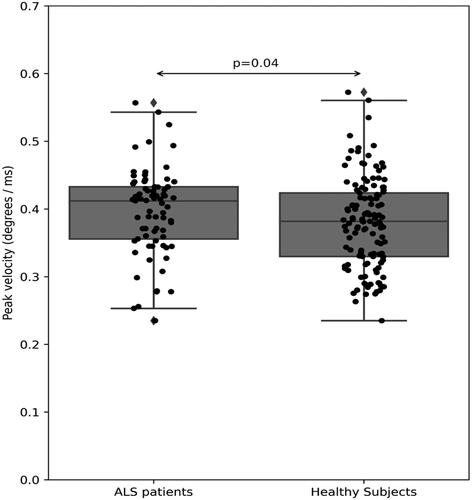
Figure 5 Pro-saccade gain (%) of ALS patients with (left) versus without (middle, p = 0.01) bulbar symptoms and healthy subjects (right, p = 0.02).
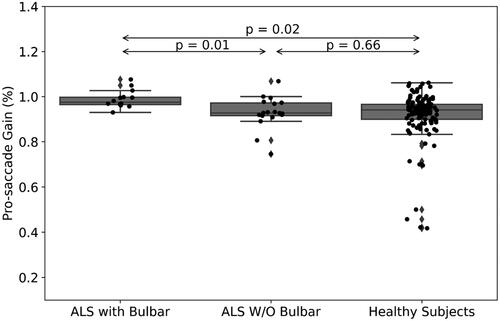
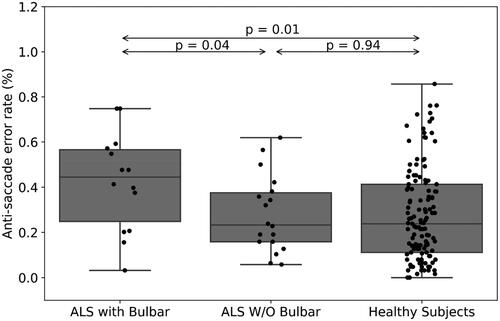
Figure 6 Anti-saccade error rate (%) of ALS patients with (left) versus without bulbar symptoms (middle, p = 0.04) and versus healthy subjects (right, p = 0.01).