
Figures & data
Figure 1. MND subgroups’ distribution.
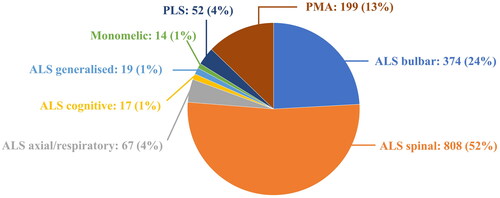
Table 1. Demographic and clinical characteristics of MND patients.
Table 2. Demographic and clinical characteristics of PMA and ALS patients according to the site of onset.
Figure 2. Kaplan–Meier survival curves stratified by phenotype.
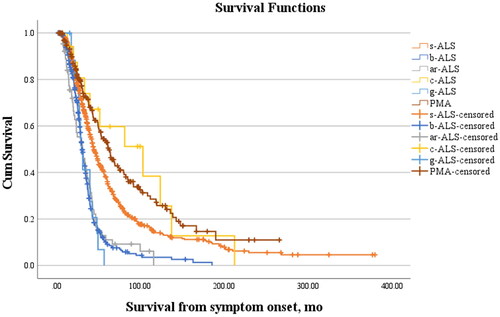
Table 3. Demographic and clinical characteristics of s-ALS, b-ALS and PMA patients according to group period.
Table 4. Multivariate Cox regression model- Independent survival predictors.
Supplemental material
Supplemental Material
Download MS Word (24.2 KB)Data availability statement
The data that support the findings of this study are available from the corresponding author, [IA], upon reasonable request.