
Figures & data
Table 1. Data summary for case studies. For disease duration analysis, restricted mean and median estimates are obtained from the survival curve and the standard error (SE) and 95% confidence interval (CI) indicates certainty in this estimate; the distribution of disease duration in non-censored individuals is reported directly. In age of onset analysis no person is censored, therefore estimates correspond with the raw descriptive statistics. *Minimum and maximum shown because disease duration was only available for two people. SD = standard deviation.
Figure 1 Variant characteristics for the native dataset. Panel A: The canonical SOD1 amino acid sequence (bold) and variants recorded at each residue, denoted using IUPAC amino acid nomenclature (Citation16), where “X” indicates protein truncating variants. Alternating background shading indicates residues encoded from different exons of the SOD1 gene. Panel B: The number of variants with at least a certain number of records available across different thresholds.
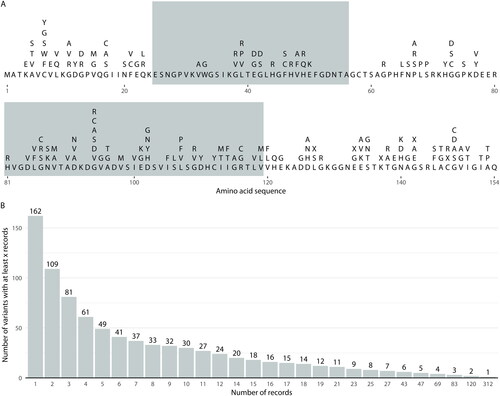
Table 2 Inferential statistics for survival analyses across case studies. Bold values denote nominal p values <0.05. * controlling for sex in the age of onset analysis and for sex and age of onset in the disease duration analysis. #Hazard ratios greater than 1 indicate earlier age of onset/shorter disease duration in the non-reference group. †No p.G94S variants were available for the disease duration analysis. CPH = Cox proportional-hazards.
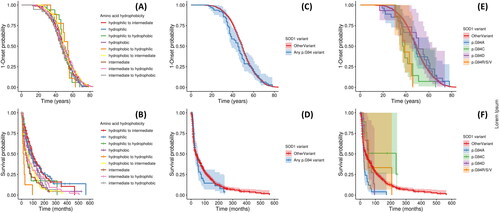
Figure 2 Kaplan-Meier survival curves for age of onset and disease duration analyses. Analysis shown: Panels A-B: trends associated with wild type and variant amino acid hydrophobicity; Panels C-D: Any SOD1 p.G94 variant versus non-p.G94 SOD1 variants (OtherVariant). Panels E-F: individual p.G94 variants versus non-p.G94 SOD1 variants. Panels A, C, and E are for age of onset analysis, and B, D, and F describe disease duration. Panels A and B display all hydrophobicity groups in a single figure for each analysis and confidence intervals are not displayed to maximize visual clarity; Figure S1 visualizes trends in age of onset and disease duration for these groups after stratifying across panels according to the hydrophobicity group of the wild type residue.
Supplemental Table
Download MS Excel (27.6 KB)Data availability statement
All data associated with this manuscript can be accessed from the web-utility: https://sod1-als-browser.rosalind.kcl.ac.uk/.