
Figures & data
Table 1. Demographic and clinical characteristics of people with ALS, overall and according to disease progression category.
Table 2. Time from symptom onset to milestones according to progression rate (all people with ALS).
Table 3. Time from symptom onset to milestones according to progression rate (people with ALS in the US).
Table 4. Time from symptom onset to milestones according to progression rate (people with ALS in Europe).
Figure 1. Time from symptom onset to milestones for all people with ALS.
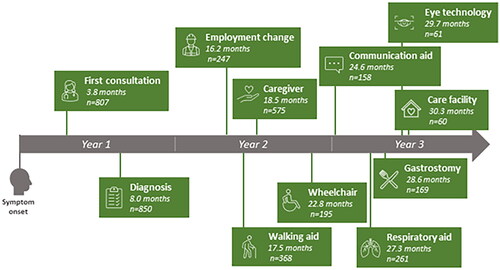
Figure 2. Time from symptom onset to milestones according to progression rate. Y: year. Error bars show 95% confidence intervals
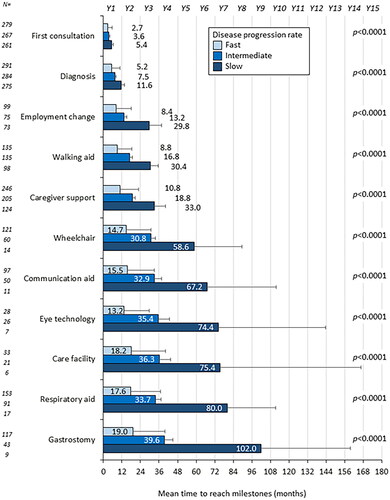
Figure 3. Time from symptom onset to milestones according to region (Europe versus US). US: United States of America; Y: year. Error bars show 95% confidence interval
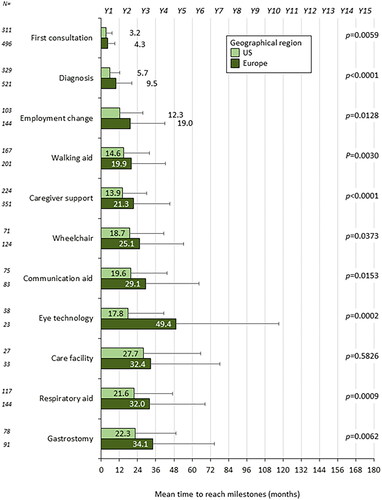
Table 5. Time from symptom onset to milestones according to region (US or Europe).