
Figures & data
Table 1. Diagnosis codes used to define ALS symptoms by origin and sub-classification.
Table 2. Summary of Study Cohort. All values are reported as number (percent) when discrete or mean (inner quartile range) for continuous values. Age, sex, and enrollment time was including in the matching scheme and noted here (all with standardized mean differences below 0.001).
Table 3. Adjusted odds ratios for acquiring a future diagnosis of ALS after having any of the study symptoms, only bulbar, or only motor symptoms, living in an urban area, and the interaction of having the symptom and living in an urban area.
Figure 1. Odds Ratio for a Future Diagnosis of ALS by Specific Symptom. All symptoms were associated with increased odds of a future ALS diagnosis; however, the effect was variable by the specific symptom. More common and less ALS-specific symptoms had lower odds ratios. Points are the estimated OR, lines denote the 95% CI.
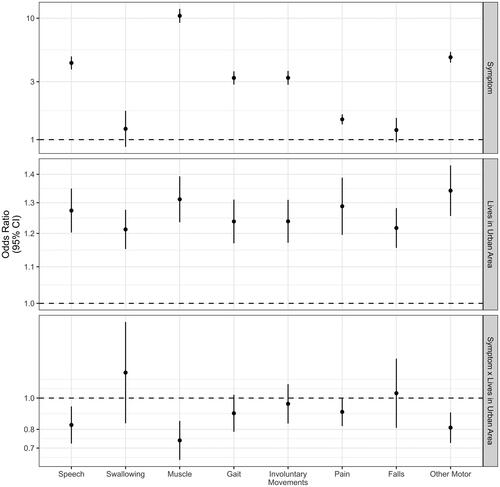
Table 4. Full model estimates for acquiring an ALS diagnosis by number of symptoms. Note the interaction between living in an urban area and having 8 symptoms could not be estimated (there were not individuals with 8 symptoms in both rural and urban settings).
Figure 2. Odds Ratio for a Future Diagnosis of ALS by Exclusion Period Length. For each exclusion period, we estimate a model where we exclude anyone who had their first possible-ALS-symptoms within the exclusion period before their ALS diagnosis. For example, if the exclusion period was 90 days, we would remove any cases of ALS where the first time they were diagnosed with the possible-ALS-symptom was less than 90 days before they were diagnosed with ALS. Each point is the estimate from a model incorporating that exclusion period and the lines denote 95% CIs. The OR associated with possible-ALS-symptoms starts to increase rapidly starting approximately 1 year before the person is diagnosed with ALS. This suggests ALS symptoms may start appearing and being noted clinically at least 1 year before the diagnosis of ALS is made.
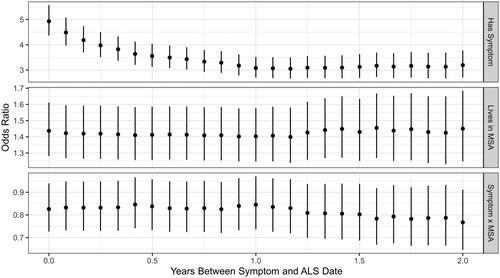
Figure 3. Kaplan-Meier Survival Curves for Age at ALS Diagnosis. Panel A shows a younger age-at-diagnosis among people living in urban vs non-urban locations. Panel B shows a younger age-at-diagnosis for people with vs without possible-ALS-symptoms. Panel C shows younger age-at-diagnosis with more possible-ALS-symptoms. Panel D shows an interaction between having symptoms and living in an urban area – both with and without symptoms, people in urban areas are diagnosed at younger ages than their non-urban peers; however, the difference between urban and non-urban patients with a symptom history is much smaller.
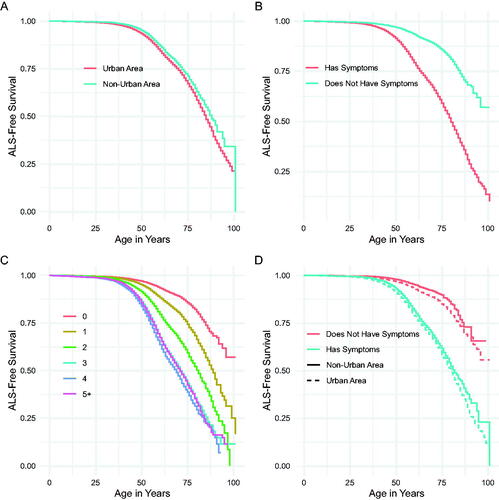
Table 5. Cox proportional hazards regression on age at diagnosis with ALS. Hazard ratios > 1 indicate younger age at diagnosis.
Supplemental Material
Download MS Word (64.1 KB)Code availability
The data extraction, processing, and analysis code is shared at https://github.com/iacobus42/als-sx.