Figures & data
Figure 1. Flow chart showing search strategy and the number of papers in the systematic review.
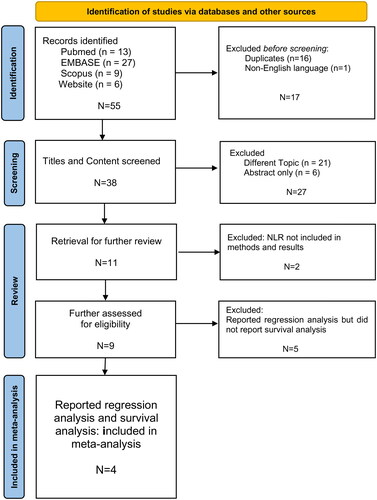
Figure 2. This figure shows the hazard ratios reported in the studies identified in the systematic review together with the hazard ratio calculated from our local cohort. The hazard ratios were calculated using Cox-Proportional-Hazard-Ratios.
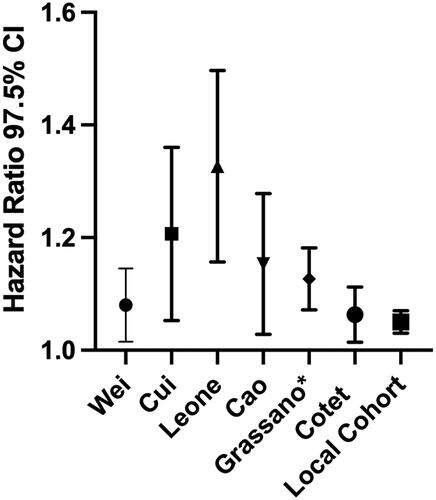
Table 1. Summary of studies of NLR and ALS survival identified by systematic review.
Table 2. Cox-proportional-hazards regression analysis results in studies identified by systematic review.
Table 3. NLR at diagnosis and survival in the four studies included for meta-analysis: Kaplan-Meier and Cox-proportional-hazards regression analysis results.
Table 4. Characteristics of Queensland ALS cohort shown in NLR tertiles.
Figure 3. Kaplan-Meier Curves and Scatter Plots comparing NLR tertiles and survival of the Queensland ALS Cohort from date of symptom onset, and date of first NLR. TOP: Kaplan-Meier curves comparing the NLR tertiles with log survival - T3 showing significantly poorer survival in both. BOTTOM Scatter plots showing survival and NLR for the cohort– R2 = 0.016 for date of symptom onset, and R2 = 0.023 for date of NLR. These both indicate low overall association between survival and NLR.
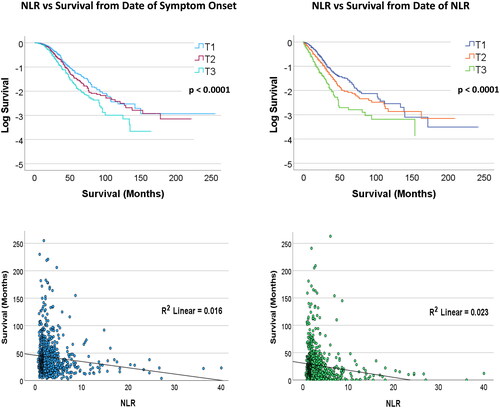
Table 5. Univariable Cox-regression analysis of the Queensland ALS Cohort: NLR tertiles vs survival from date of symptom onset.
Table 6. Multivariable Cox-regression analysis of the Queensland ALS Cohort: NLR and variables vs survival from date of symptom onset.
Table 7. Comparison of NLR cutoff value groups versus survival from date of symptom onset in the Queensland ALS Cohort.
Figure 4. Kaplan-Meier Curves comparing NLR tertiles and survival from date of symptom onset shown by sex in the Queensland ALS Cohort. T3 is associated with poorer survival in both females and males.
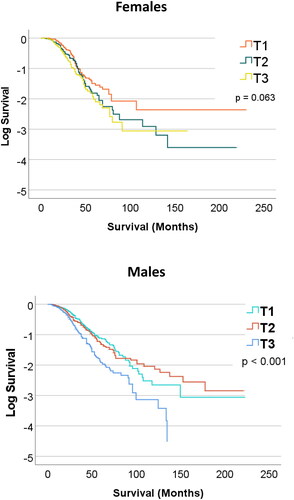
Table 8. Comparison of NLR tertiles versus survival from date of symptom onset, based on subject sex in the Queensland ALS Cohort.
Figure 5. ROC Curves showing NLR and Survival in the Queensland ALS cohort from date of symptom onset, and date of first NLR. TOP: < 2 years survival. BOTTOM: < 5 years survival. In the cohort, 234 patients (28%) live less than 2 years, and 149 patients (18%) live more than 5 years.
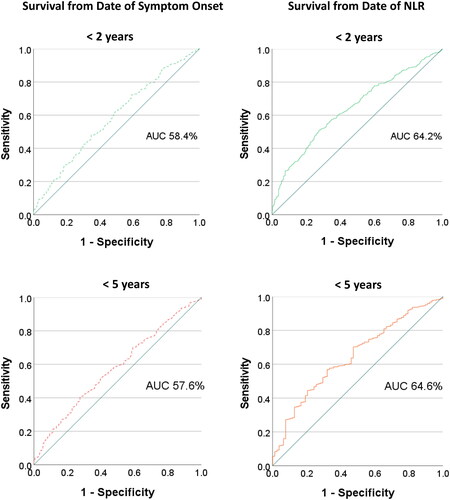
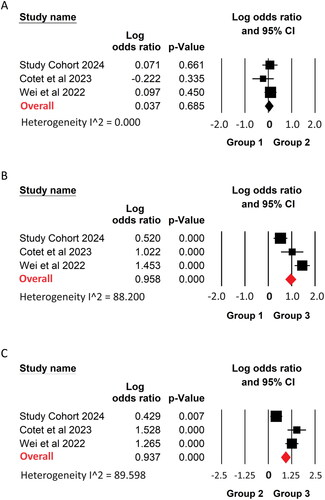
Figure 6. Forest Plots showing meta-analysis comparing NLR Tertiles versus survival from date of symptom onset. NLR T3 shows significantly poorer survival compared with both T1 (B) and T2 (C). There is no significant survival difference between T1 and T2 (A).
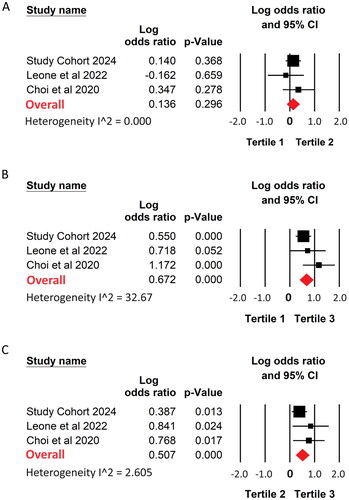
Figure 7. Forest Plots showing meta-analysis comparing NLR cutoff value groups versus survival from date of symptom onset. NLR Group 3 shows significantly poorer survival compared with both Group 1 (B) and Group 3 (C). There is no significant survival difference between Group 1 and Group 2 (A).