
Figures & data
Figure 1. The vicious cycle of inflammation and infection and potential therapeutic interventions [Citation9]. Reproduced with permission of the European Respiratory Society ©. Eur J Respir Dis Suppl. 1986; 147: 6–15.
![Figure 1. The vicious cycle of inflammation and infection and potential therapeutic interventions [Citation9]. Reproduced with permission of the European Respiratory Society ©. Eur J Respir Dis Suppl. 1986; 147: 6–15.](/cms/asset/9f81d82c-adf3-40bf-a975-ed31bcd4f50f/ieod_a_1196129_f0001_b.gif)
Table 1. The exact prevalence of bronchiectasis is unclear and there are differing reports across the US, Europe and Asia Pacific.
Table 2. Ongoing and recent clinical trials of inhaled antibiotics in NCFB.
Box 1. Drug summary
Figure 2. Ciprofloxacin DPI drug and device.
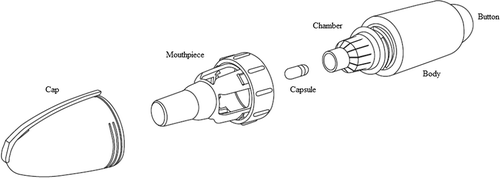
Table 3. Key pharmacokinetic/pharmacodynamics properties of ciprofloxacin DPI in plasma and sputum.
Figure 3. Phase II study results: significant reductions in bacterial load were seen for patients treated with ciprofloxacin DPI [Citation55]. Mean bacterial load for the modified intent-to-treat population treated with ciprofloxacin DPI in the Phase II study. Shaded area indicates treatment period (days). Mean reductions in colony forming units at end of therapy were significantly higher ciprofloxacin DPI vs placebo: −3.62 log10 CFU·g−1, range −9.78–5.02 log10 CFU·g−1 vs −0.27 log10 CFU·g−1, range −7.96–5.25 log10 CFU·g−1 *** p = 0.001. Reproduced with permission of the European Respiratory Society ©: European Respiratory Journal May 2013, 41 (5) 1107‐1115; Doi: 10.1183/09031936.00071312.
![Figure 3. Phase II study results: significant reductions in bacterial load were seen for patients treated with ciprofloxacin DPI [Citation55]. Mean bacterial load for the modified intent-to-treat population treated with ciprofloxacin DPI in the Phase II study. Shaded area indicates treatment period (days). Mean reductions in colony forming units at end of therapy were significantly higher ciprofloxacin DPI vs placebo: −3.62 log10 CFU·g−1, range −9.78–5.02 log10 CFU·g−1 vs −0.27 log10 CFU·g−1, range −7.96–5.25 log10 CFU·g−1 *** p = 0.001. Reproduced with permission of the European Respiratory Society ©: European Respiratory Journal May 2013, 41 (5) 1107‐1115; Doi: 10.1183/09031936.00071312.](/cms/asset/e3ae05bb-81d8-41a7-9398-4c68b73b2869/ieod_a_1196129_f0003_b.gif)
Figure 4. RESPIRE 1 and 2 treatment regimens [Citation56].
![Figure 4. RESPIRE 1 and 2 treatment regimens [Citation56].](/cms/asset/0d328b2b-f614-4b29-a20c-70f0971f99de/ieod_a_1196129_f0004_b.gif)
Table 4. Key inclusion and exclusion criteria for the RESPIRE clinical trial program.
Table 5. Main end points in the RESPIRE clinical trial program.