Figures & data
Figure 1. Transthoracic echocardiogram (TTE) of a patient with cardiac ATTR CM. TTE demonstrating concentric left ventricular hypertrophy (left to right) 4 Chamber view, parasternal and parasternal short axis view.4 Chamber global longitudinal strain demonstrating a ‘bull’s eye pattern’, characteristic of cardiac amyloidosis
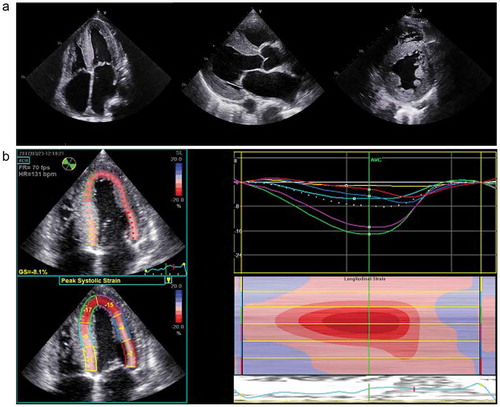
Figure 2. Cardiac MRI of a patient with ATTR CM (left to right) steady-state free precession cine; four chamber, two chamber, three chamber and short axis view demonstrating concentric LV hypertrophy
Figure 3. Cardiac MRI with phase sensitive inversion recovery reconstruction late gadolinium enhancement images demonstrating A) No LGE B) Sub-endocardial LGE and C) transmural LGE
Figure 4. Cardiac MRI short axis steady-state free precession cine (left to right) with corresponding native myocardial T1 map, corresponding myocardial T2 map, corresponding phase sensitive inversion recovery reconstruction late gadolinium enhancement image and corresponding ECV map
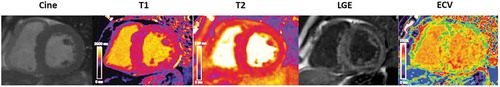
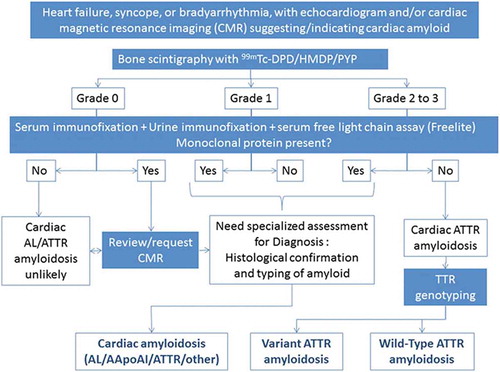
Figure 5. A) 99mTc labeledlabelled DPD scintigraphy demonstrating Perugini Grade 2 cardiac uptake in a patient with ATTR-CM