
Figures & data
Table 1. Background data for the participants.
Figure 1. The model describes the process experienced by the participants. On the top is the core category that resulted from the whole process. The large circles represent the categories, and the smaller circles the subcategories. Both large circles are connected by the MMR programme which triggered the process of change.
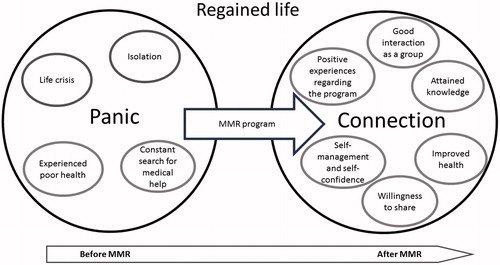
Table 2. Core category, categories, subcategories and examples of open codes.