
Figures & data
Table 1. Sample characteristics by group (n = 164).
Table 2. Category structure based on all persons who took EQ-5D-3L and EQ-5D-5LTable Footnote*.
Figure 1. (a) Visual description of the category probability curves of the EQ-5D-3L rating scale. (b) Visual description of the category probability curves of the EQ-5D-5L rating scale.
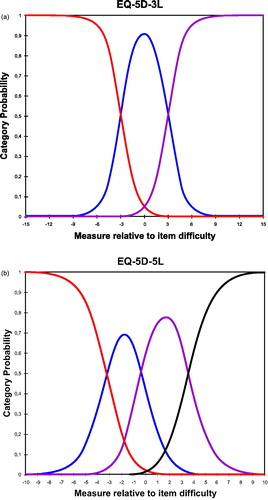
Figure 2. (a) Item-person map indicating the targeting of the persons to the items in EQ-5D-3L. Each “#” is 2 persons and each “.” is 1 person. (b) Item-person map indicating the targeting of the persons to the items in EQ-5D-5L. Each “X” is 1 person.
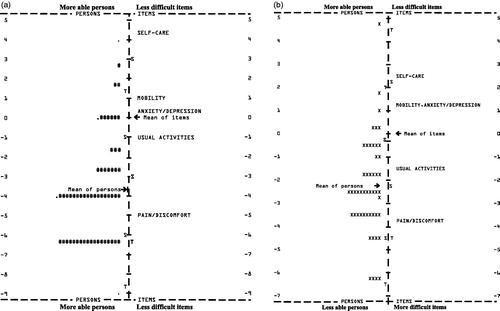
Table 3. Summary of results.