
Figures & data
Figure 1. Conditions for sickness presence and sickness absence for (A) Healthy group, (B) Semi healthy group and (C) Unhealthy group.
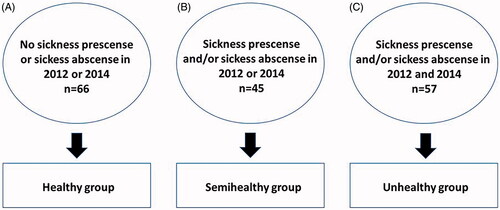
Table 2. Comparison between subgroups; (A) Healthy Group (Healthy) (n = 66), (B) Semi Healthy group (Semi healthy) (n = 45), (C) Unhealthy Group (Unhealthy) (n = 57) concerning work ability and musculoskeletal pain in percent (%).
Table 3. Physical and psychosocial work place conditions work posture, precision demands, perceived exertion psychosocial demands, work control, social support, good leadership, WEMS, SHIS in percent (%).
Table 1. Characteristics of participants (n = 168) in frequencies (n), percentages (%), and 95% confidence intervals (95%CI) and median and Quartiles (Q1, Q3) for each group; (A) Healthy Group, (B) Semi Healthy Group and (C) Unhealthy Group.
Table 4. Multinomial regression analyses in 2012 for ‘explanatory in variables’ to belonging to the subgroups of Healthy and semi healthy Group.