
Figures & data
Figure 1. Example of TLS-BasicADL protocol.
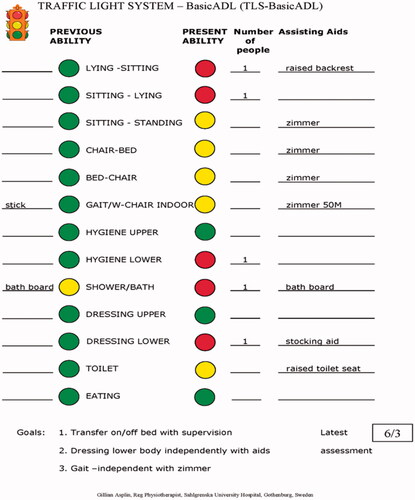
Table 1. Patient demographic characteristics of the concurrent validity study group (mixed diagnosis) and responsiveness study group (hip fracture).
Table 2. Correlation between individual item scores of Traffic Light System-BasicADL and modified Functional Independence Measure and Barthel Index, respectively.
Table 3. Correlation between total scores of Traffic Light System-BasicADL and modified Functional Independence Measure and Barthel Index, respectively.
Figure 2. Distribution of TLS-BasicADL scores. Proportion of patients requiring help, supervision or independent in the individual items of transfers and gait prior to admission, post-op, at discharge and 1-month post-discharge.
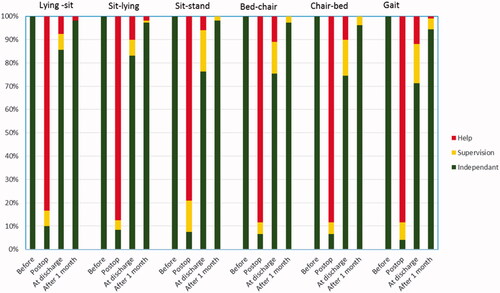
Figure 3. Distribution of TLS-BasicADL scores. Proportion of patients requiring help, supervision or independent in the individual items of ADL prior to admission, post-op, at discharge and 1-month post-discharge.
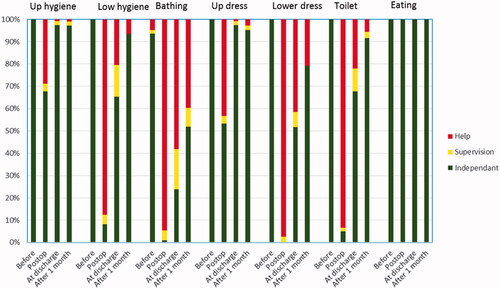
Table 4. Correlations between differences in scores for modified Katz Index and Traffic Light System-BasicADL at both item level and total scores for time periods; pre-fracture status to discharge and discharge to 1-month follow-up.