
Figures & data
Figure 1. The process of inclusion and exclusion.
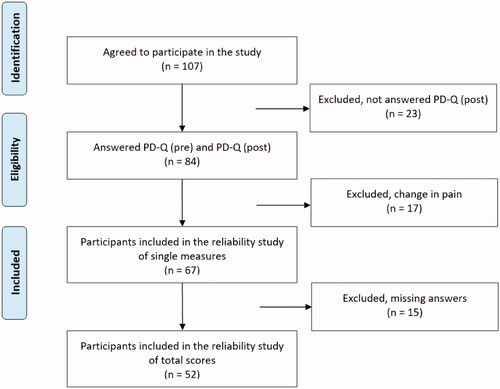
Table 1. Overview of the participants’ characteristics, N = 67.
Table 2. Missing answers PD-Q, N = 67.
Table 3. Test-retest reliability of pain intensity, N = 67.
Table 4. – Test-retest reliability of separate items in part 2, 3 and 4, N total = 67.
Table 5. Overview of percentage of agreement of separate items in part 2, 3 and 4, N total = 67.
Table 6. Overview of the PD-Q screening data, N = 52, Kappa = 0.50 (95% CI 0.31–0.69).