Figures & data
Figure 1. Flow of patients across various phases of the trial. Recontinued shows patients performing the 6MWT after not performing the 6MWT at the previous control. One patient did not perform the 6MWT at baseline and was therefore not analysed in this sub-study.
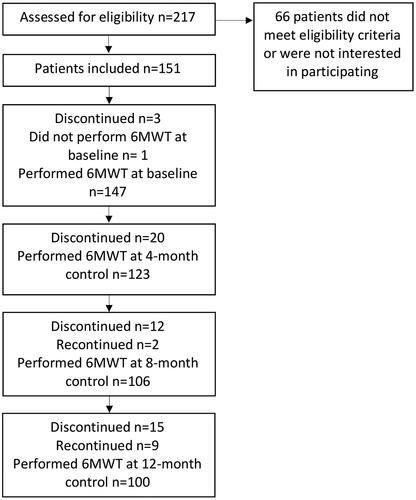
Table 1. Clinical characteristics of 147 patients at baseline.
Table 2. Adherence and exercise performance.
Table 3. Results for the 6MWT and change in walking distance after 4, 8 and 12 months of exercise.
Figure 2. The patients’ performance in the 6MWT at baseline relative to the predicted norm in relation to the difference in walking distance in metres after 12 months of exercise.
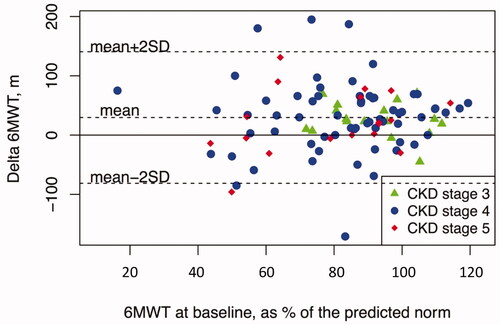
Table 4. Increase in 6MWT after 12 months of training grouped according to the different levels of weekly duration of aerobic endurance exercise.
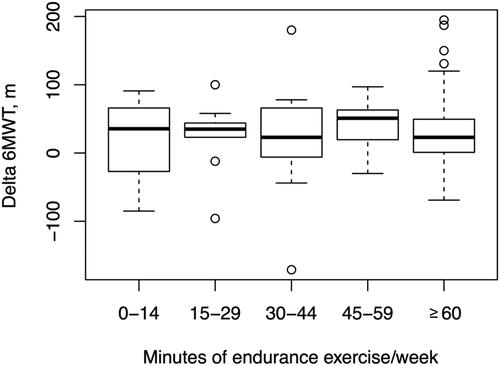
Figure 3. Change in walking distance in metres after 12 months for patients grouped according to different levels of exercise duration per week.