Figures & data
Figure 1. Conceptual framework of the proposed dynamic ridesourcing model, including references to subsections in which a particular submodel is explained.
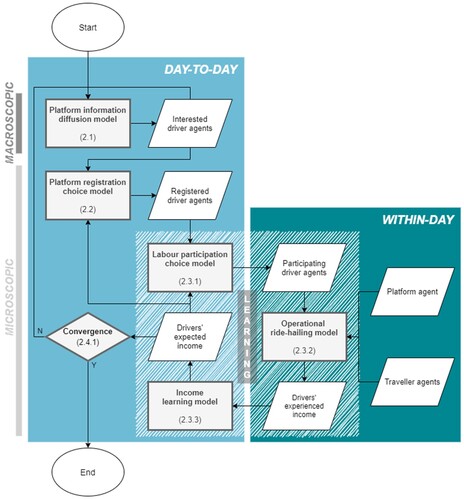
Table 1. Scenario design.
Table 2. KPIs in equilibrium for all scenarios.
Figure 2. (a) The evolution of the number of registered, informed and participating drivers, (b) the evolution of the average expected and experienced income, and (c) the distribution of expected income for participating drivers versus registered drivers in equilibrium.
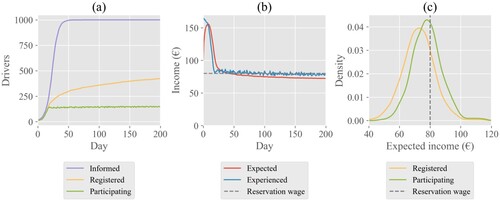
Figure 3. The effect of the size of the driver pool on the evolution of (a) the expected income of registered drivers as ratio of their reservation wage, (b) the share of requests that are satisfied, (c) the average waiting time for pick-up for travellers, (d) daily participation volumes, (e) the total number of registered drivers, and (f) the share of registered drivers that participate.
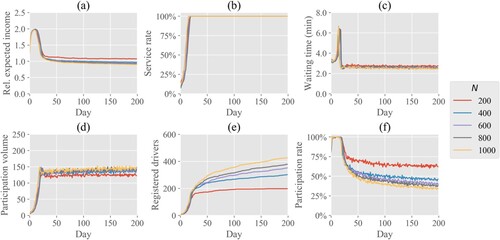
Figure 4. The effect of (homogeneous) reservation wage on the evolution of (a) the expected income of registered drivers as ratio of their reservation wage, (b) the share of requests that are satisfied, (c) the average waiting time for pick-up for travellers, (d) daily participation volumes, (e) the total number of registered drivers, and (f) the share of registered drivers that participate.
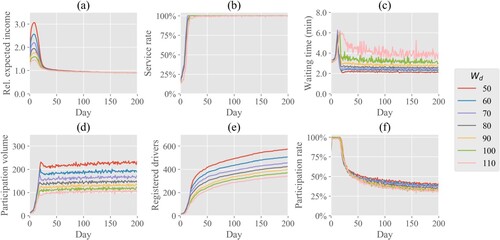
Figure 5. The effect of heterogeneity in reservation wage on (a) the evolution of the average expected income of registered drivers as ratio of their reservation wage, (b) the evolution of the total number of registered drivers, (c) the evolution of daily participation volumes, (d) the probability density function of reservation wage for registered drivers, (e) the evolution of average experienced income of participating drivers as ratio of their reservation wage and (f) the evolution of the average waiting time for pick-up for travellers.
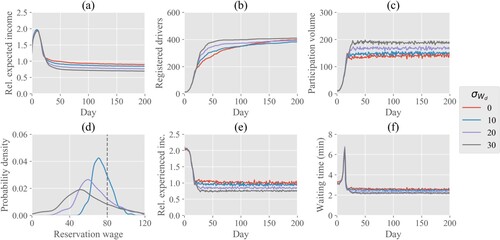
Figure 6. The effect of the valuation of income in participation choice on (a) the evolution of the average expected income of registered drivers as ratio of their reservation wage, (b) the evolution of average experienced income of participating drivers as ratio of their reservation wage, (c) the evolution of daily participation volumes, (d) the probability density function of expected income (as ratio of their reservation wage) for registered drivers, (e) the evolution of the total number of registered drivers and (f) the evolution of the average waiting time for pick-up for travellers.
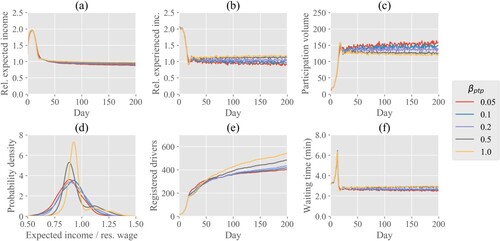
Figure 7. The effect of platform commission rate on the evolution of (a) expected income of registered drivers as ratio of their reservation wage, (b) the share of requests that are satisfied, (c) the average waiting time for pick-up for travellers, (d) daily participation volumes, (e) the total number of registered drivers, and (f) daily platform profit.
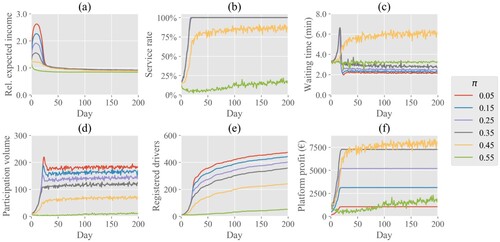
Figure 8. The effect of registration costs on the evolution of (a) the total number of registered drivers, (b) daily participation volumes, (c) average experienced income of participating drivers as ratio of their reservation wage, (d) the average expected income of registered drivers as ratio of their reservation wage, (e) average experienced income of participating drivers as ratio of the sum of their reservation wage and daily share of registration costs and (f) the average waiting time for pick-up for travellers.
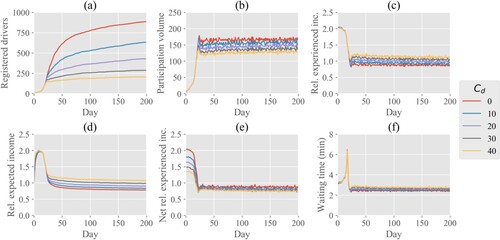
Figure 9. Optimality of supply in a system with fare-based driver payouts (assuming a platform commission rate of 25%) and a system with wage-based driver payouts, for (a) the service provider, aiming at maximum profit, (b) the traveller union, minimising costs from waiting and rejected requests, (c) the driver union, maximising driver earnings over the reservation wage, and (d) an authority that evaluates the three previous objectives equally, maximising the summed net value.
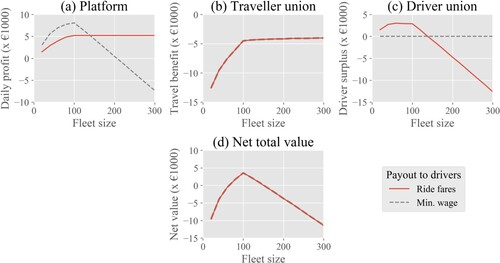
Figure 10. The effect of the rate of learning on (a) the evolution of the average expected income of registered drivers as ratio of their reservation wage, (b) the probability density function of expected income (as ratio of their reservation wage) for registered drivers, (c) the evolution of daily participation volumes, (d) the evolution of average experienced income of participating drivers as ratio of their reservation wage, (e) the evolution of the average waiting time for pick-up for travellers and (f) the evolution of the total number of registered drivers.
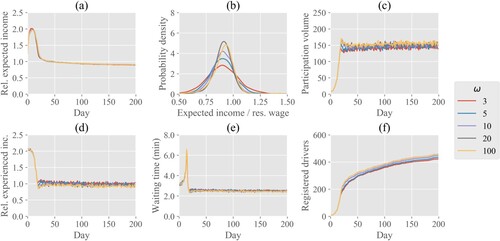
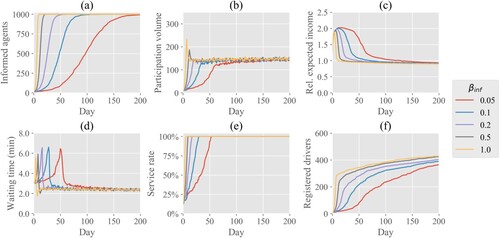
Figure 11. The effect of the information transmission rate on the evolution of (a) the number of informed agents, (b) daily participation volumes, (c) the average expected income of registered drivers as ratio of their reservation wage, (d) the average waiting time for pick-up for travellers, (e) platform profit and (f) the total number of registered drivers.