Figures & data
Figure 1. Segmentation of the SCAT layer from MRI scan: (from left to right) exterior geometry initialisation, segmented exterior geometry, segmented interior geometry, orthogonal slices of the segmented geometries.
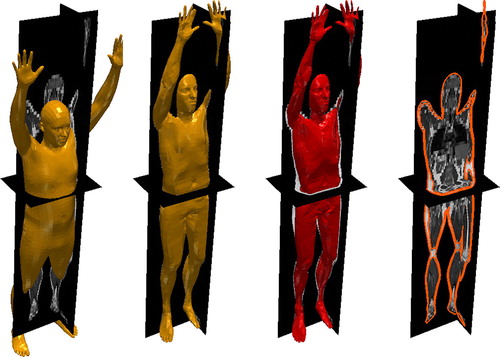
Figure 2. The axial slices of the segmented geometries of the subcutaneous fat layer from MRI data-set of BMI 23 using the proposed model.
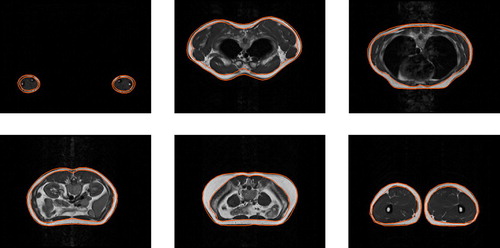
Figure 3. Segmentation of the subcutaneous fat layer from MRI scans (from left to right, increasing BMIs 19, 22, 23, 25, 35): the top row depicting coronal slices, and the bottom row depicting the manually labelled slices (yellow) and the corresponding axial slices segmented (orange) using the proposed model.
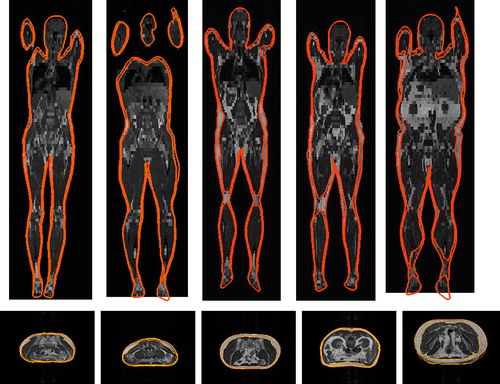
Table 1. Comparison of the segmentation of SCAT of the different MRI data-sets using the proposed model to manual segmentation, depicting the Dice similarity coefficient (DSC), sensitivity, specificity and overall accuracy of the segmented geometries (%).
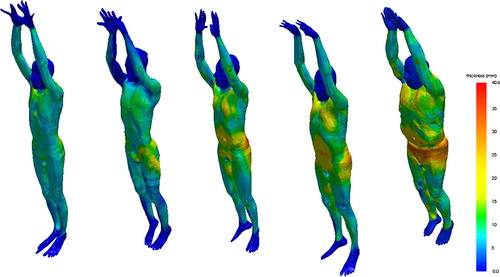
Figure 4. Subcutaneous fat thickness (mm) computed on the vertices of the exterior geometries: (from left to right) MRI data-sets of BMIs 19, 22, 23, 25 and 35.