Figures & data
Figure 1. Proposed framework of nodule identification. Graphical illustration of the proposed pipeline that contains three modules. RePoint-Net was trained with dataset LIDC/IDRI the trained model as nodule or non-nodule. The model segmented of lung and nodules of detected in RePoint-Net. classification of nodules candidate by proposed 3DCNN as nodule benign or nodule malignant.
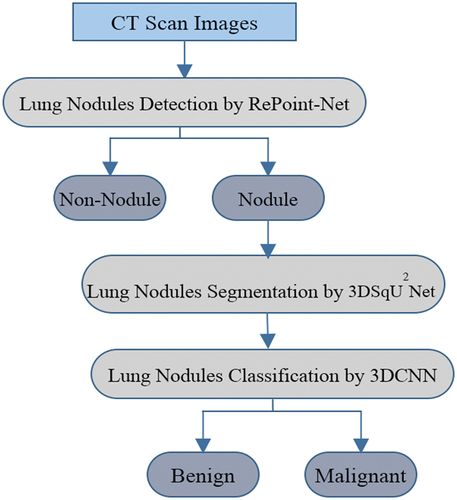
Figure 2. Proposed structure for RPN anchor selection.
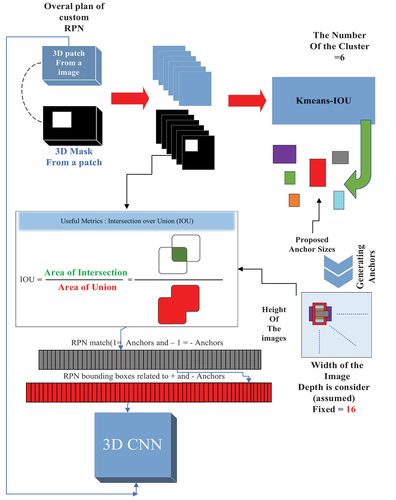
Figure 3. Schematic representation of the RePoint-Net method for identifying nodules pulmonary.
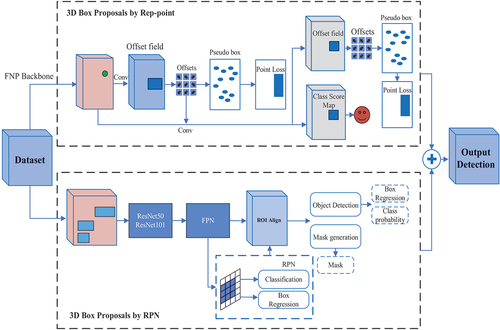
Table 1. Variables used in our method.
Figure 4. The architecture of the encoder network.
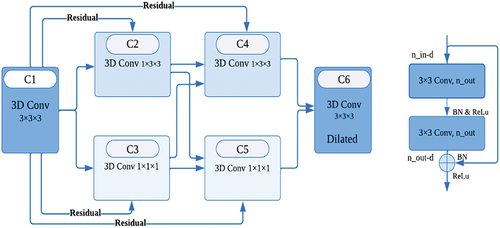
Figure 5. The architecture of the Net network for segmentation of pulmonary nodules.
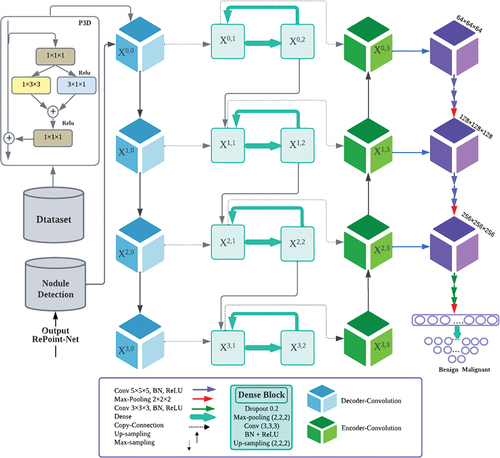
Figure 6. Our proposed 3D deep CNN architecture.
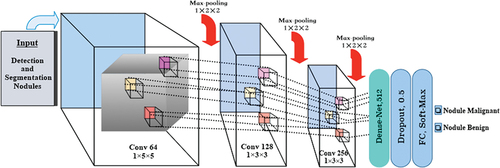
Table 2. Annotation of nodule characteristic scoring.
Table 3. Definition of TP, FP, FN, TN.
Table 4. System performance of nodule candidate detection.
Table 5. Detection of nodules based on diameters with RePoint-Net.
Figure 7. Likelihood ratios for positive and negative results of RePoint-Net.
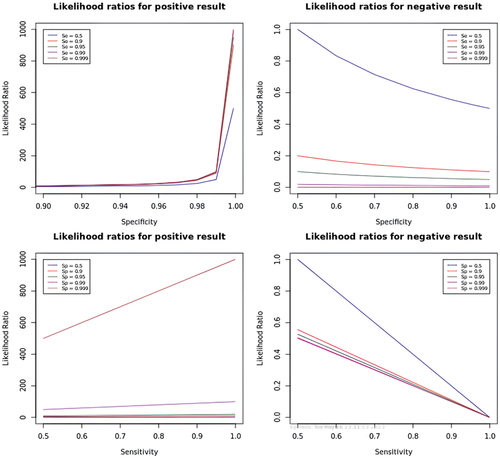
Table 6. The segmentation results of the proposed model for 1018 pulmonary nodules category of texture.
Figure 8. The table label describes the ROC curve, which demonstrates the balance between sensitivity and specificity at different classification thresholds. An ideal classifier would achieve a TPR of 1.0 and an FPR of 0.0 at all threshold values, resulting in a ROC curve with a TPR of at least 0.93 at an FPR of 0.01 or below. The classifier’s performance is summarized by the area under the curve (AUC) with a range of 0.0 to 1.0, where 0.5 indicates random guessing and 1.0 shows a perfect classifier. The classifier discussed has an AUC of 0.986, indicating strong discrimination power between nodule-benign and nodule-malignant cases.
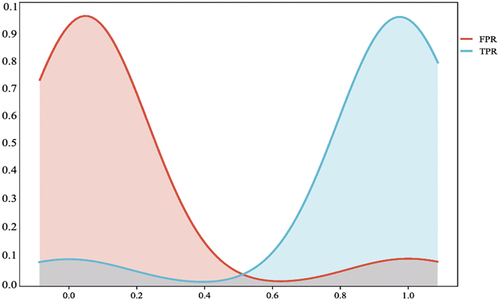
Table 7. ROC curve threshold table.
Table 8. The confusion matrix of our method.
Table 9. Classification of nodules using 3DCNN.
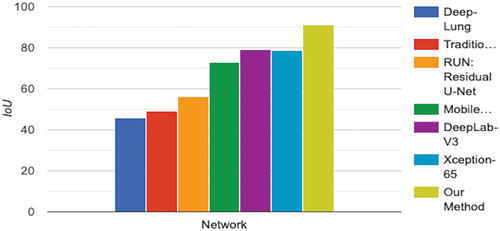
Table 10. IoU scores between different variants of U-Net and the proposed method.
Figure 9. Comparison of the IoU between our model and prior models. The results show that prior models outperform the baseline method implementation and standard.