
Figures & data
Figure 1. Standard clinical hip DXA images. (a) hip DXA image from the CLSA, with the white boundary lines (b) hip DXA image from the CaMos, with no white boundary lines.
Figure 2. Proposed CNN strategy to automatically detect the contour. First, the input images are applied to the proposed U-net architecture, which will output the predicted masks of each image. Then by applying thresholding, the contour is extracted and is then overlayed on the original input image.
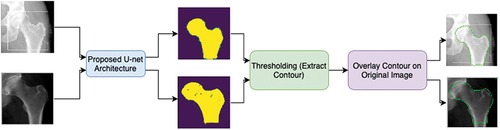
Figure 3. (a) corresponding ‘true output’ of the input image () and (b) corresponding ‘true output’ of the input image ().
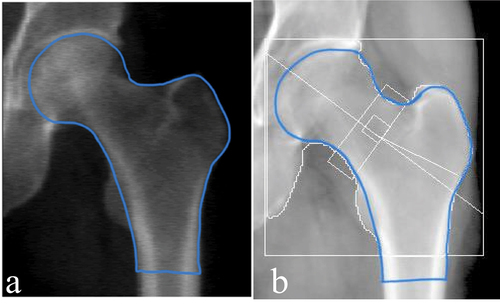
Figure 4. (a) the ‘true output’ image manually drawn. (b) the image was binarized based on the pixel intensity. (c) the binary outline was subsequently filled to represent the region of the hip and proximal femur.
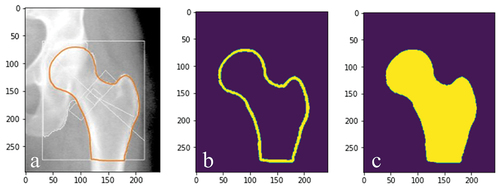
Figure 5. Proposed U-net architecture. (a) contracting path, (b) expanding path.
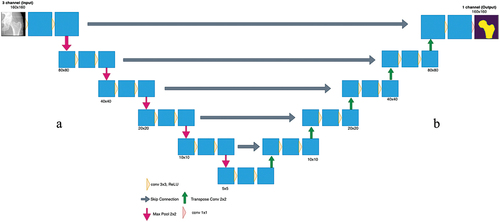
Figure 6. For the CaMos dataset, a) the loss of the training data over the span of 150 epochs. b) the loss of the validation data over 150 epochs.
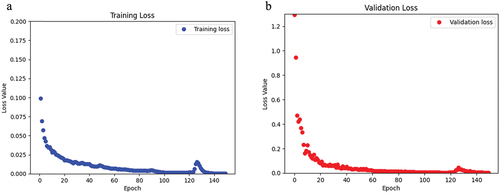
Table 1. Summary of U-net output.
Figure 7. For the CLSA dataset, a) the loss of the training data over the span of 170 epochs. b) the loss of the validation data over 170 epochs.
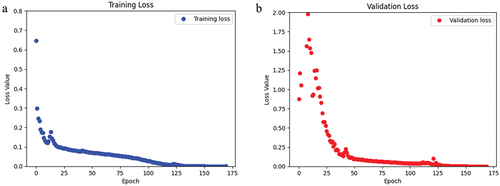
Figure 8. For the CaMos augmented dataset, a) the loss of the training data over the span of 150 epochs. b) the loss of the validation data over 150 epochs. For the CLSA augmented dataset, c) the loss of the training data over the span of 170 epochs. d) the loss of the validation data over 170 epochs.
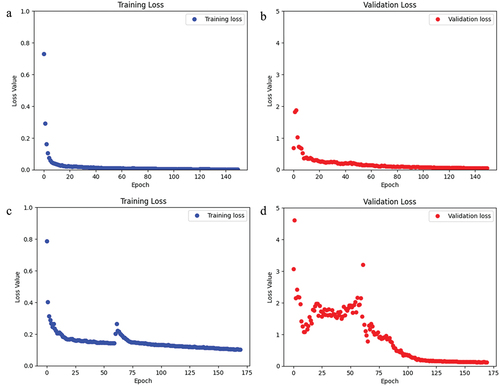
Table 2. Summary of U-net output with the augmented data.
Figure 9. a) CaMos hip DXA scan from testing set. b) the corresponding predicted output mask from the model. c) the contour projected on to the original input image.
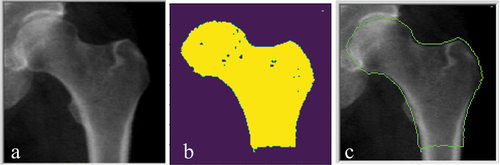
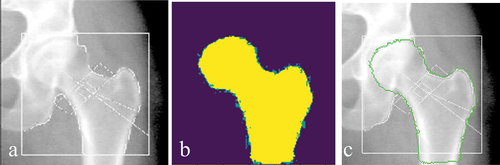
Figure 10. a) CLSA hip DXA scan from testing set. b) the corresponding predicted output mask from the model. c) the contour projected on to the original input image.
Data availability statement
Data are available from the Canadian Longitudinal Study on Aging (www.clsa-elcv.ca) for researchers who meet the criteria for access to de-identified CLSA data.