
Figures & data
Figure 1. Experimental setup workflow diagram.
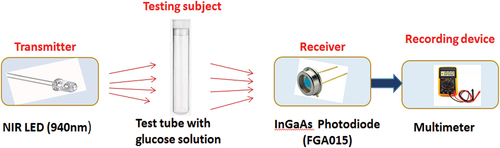
Figure 2. Experimental setup (a) circuit diagram (b) experimental setup.
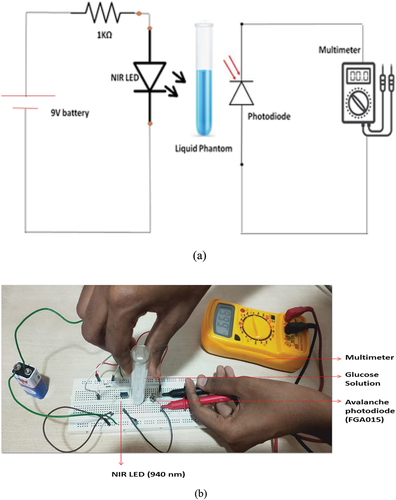
Figure 3. Workflow diagram for the blood glucose monitoring system.
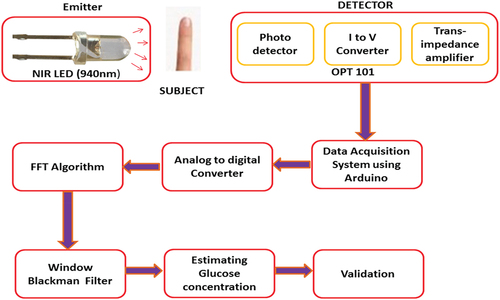
Figure 4. OPT101 light intensity sensor.
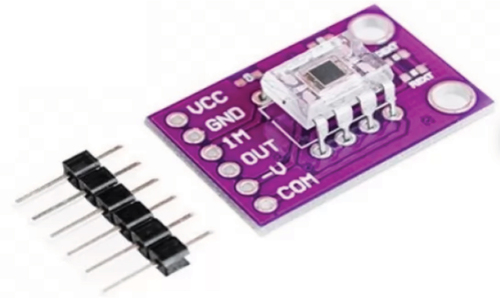
Figure 5. Passing of light beam in liquid phantom.
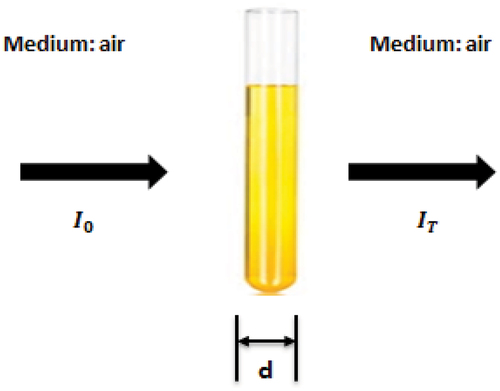
Figure 6. Passing of light beam in human fingertip.
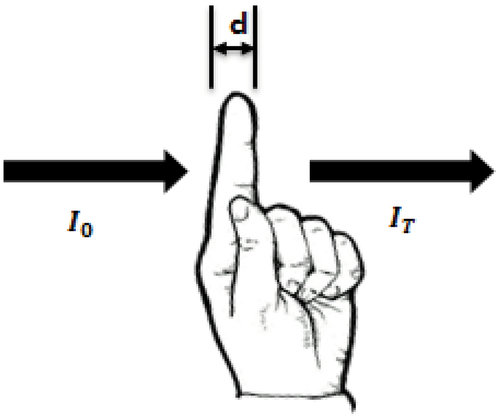
Figure 7. Variation in voltage flow for the corresponding glucose concentration.
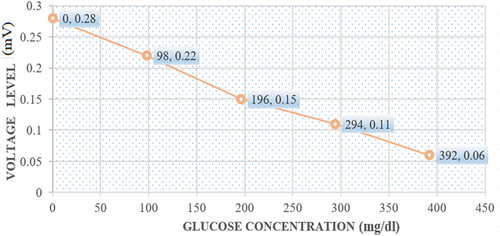
Figure 8. Variation in current flow for the corresponding concentration of glucose.
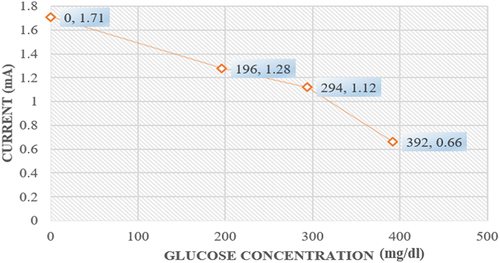
Figure 9. Prototype of the complete glucose estimation system (a) prototype setup (b) fingertip subject placed over OPT101 (c) transmission and reception of optical light (d) entire set-up covered with black cloth.
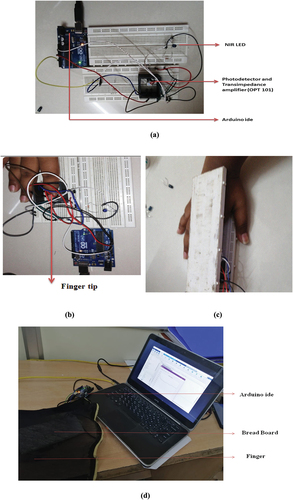
Figure 10. Estimated glucose level using non-invasive technique.
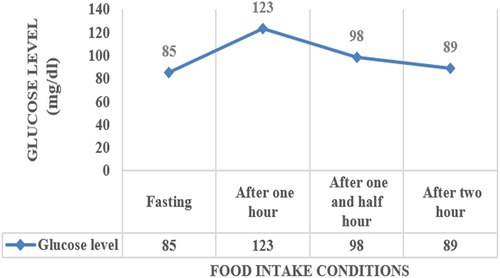
Figure 11. Validation of Non-invasive technique using an invasive device for a person.
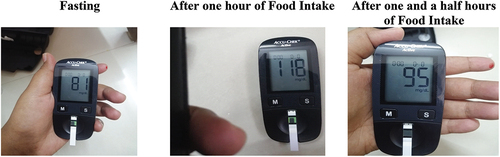
Table 1. Correlation between the commercially available fingerprick method (invasive) and sensor-based method (non-invasive) on four volunteers.
Figure 12. Clarke grid error analysis.
Data availability statement
The data used to support the findings of this study are included in the article.