
Figures & data
Figure 1. Model pipeline showing each step in the development process. The software used in each step is shown in parentheses.
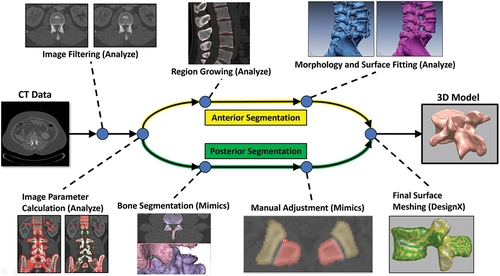
Figure 2. Spine geometry database. The label above each spine identifies the subject age and gender.
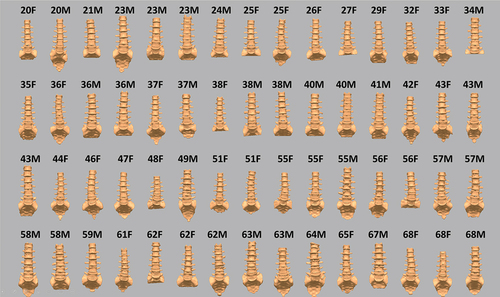
Figure 3. Example showing the creation of a datum plane representing the superior vertebral endplate extracted from surface data.
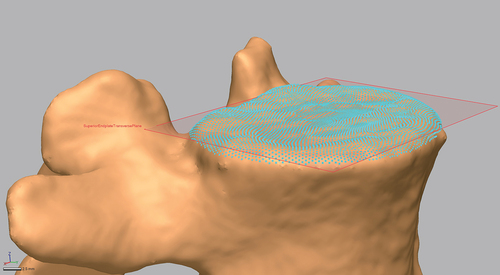
Figure 4. Vertebral body geometric measures.
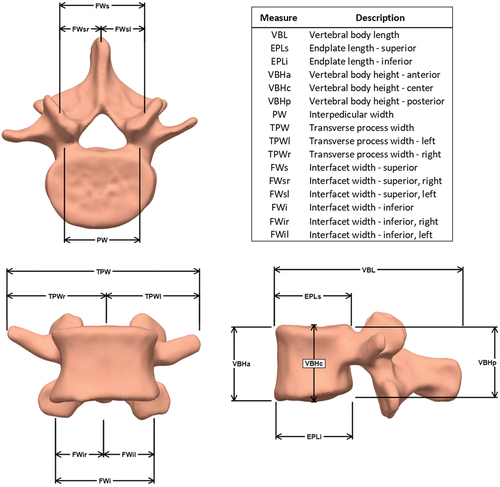
Table 1. Statistically significant main and interaction effects for each of the geometric measures. Bold elements denote a statistically significant result (p < 0.05). See figure 4 for a description and visual representation of each measure in the table.
Figure 5. Vertebral body height and length measures as a function of vertebral level.
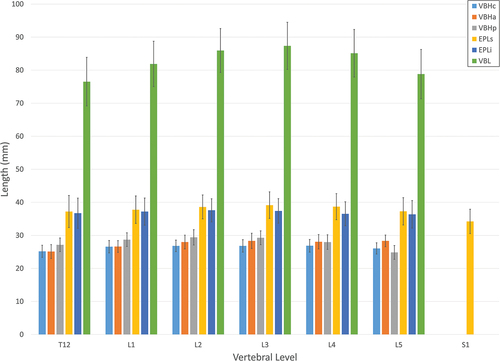
Figure 6. Interfacet, interpedicular, and transverse process width measures as a function of vertebral level.
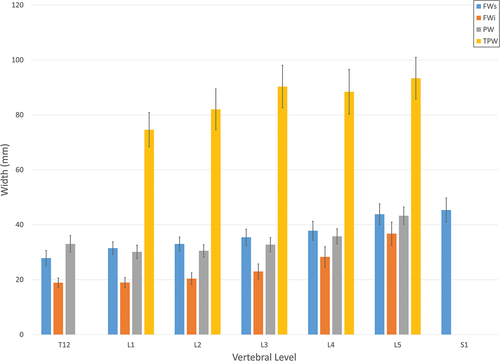
Table 2. Vertebrae measurement comparison with previous geometry studies (mm). See figure 4 for a description and visual representation of each measure in the table.