
Figures & data
Table
Figure 1. The flowchart of the proposed image segmentation method.
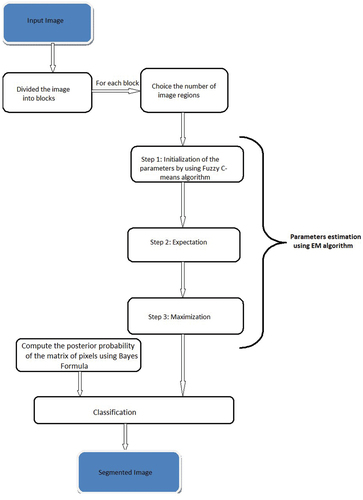
Table 1. Other riesz mixture models.
Table 2. The resulting estimated parameters using the EMR and their distances toward the actual parameters.
Table 3. The resulting estimated parameters using the EMW and their distances toward the actual parameters.
Figure 2. The original synthetic image.
Figure 3. Synthetic noisy images for the different riesz mixture models.
Figure 4. Simulated segmented images by the mixture model 1.
Figure 5. Simulated segmented images by the mixture model 2.
Figure 6. Simulated segmented images by the mixture model 3.
Table 4. Different evaluation criteria values with Riesz and Wishart distributions.
Figure 7. Real brain MR image and its blocks.
Figure 8. Segmentation results of the brain image. (a) the segmented image by the riesz distribution, (b) the segmented image by the Wishart distribution.
Figure 9. Segmentation results of the brain image. (c) the segmented image by the riesz distribution, (d) the segmented image by the Wishart distribution.
Table 5. The MCR and PSNR values by varying mixture with brain images.