
Figures & data
Figure 1. Fundus image (a) healthy eye (b) glaucomatous eye (c) glaucomatous image marked by the expert.
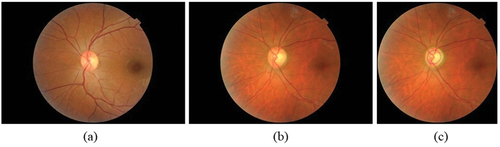
Figure 2. Proposed deep CNN model with visualization of features.
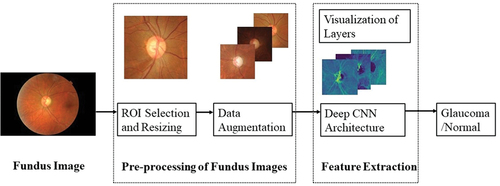
Figure 3. Pre-processing of fundus image with glaucoma (a) entire image (b) fundus image cropped around OD (c) fundus glaucoma image cropped around ONH including RNFL region (d) segmented optic disc region.
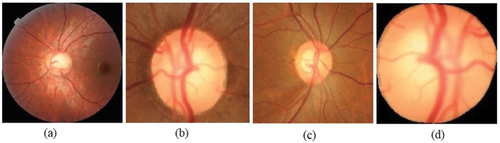
Figure 4. Examples of the ROI in the fundus images cropped around the ONH including RNFL region for both normal and glaucomatous images.
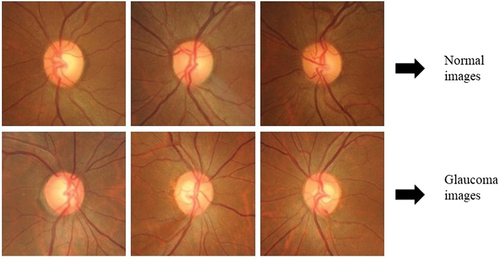
Table 1. Fundus dataset before and after augmentation.
Figure 5. The proposed deep CNN architecture.
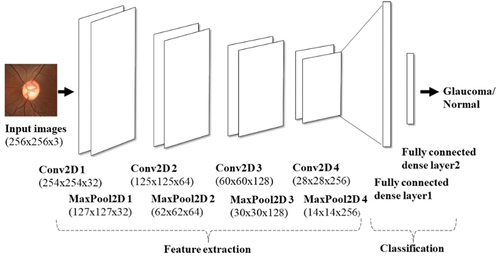
Table 2. Details of the proposed deep CNN architecture.
Table 3. The list of hyperparameters for the ImageNet trained architectures.
Table 4. Total images used for training and testing the architecture.
Figure 6. Visualization of the feature maps of first layer of activation. The first row is a feature map of mild glaucoma, the second row is moderate glaucoma, and the third row is severe glaucoma. The feature maps are plotted for the 7th and 16th channels which are taken randomly out of the 32 channels in the first activation layer.
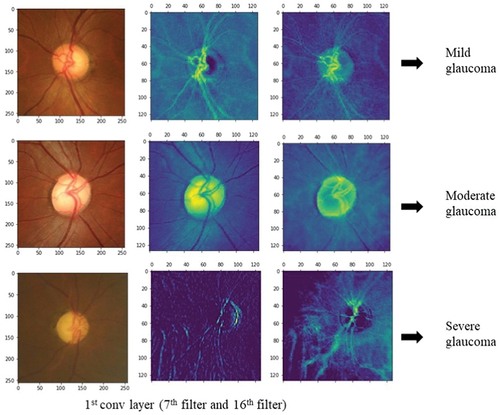
Figure 7. Accuracy curve and loss curve of mild glaucoma class.
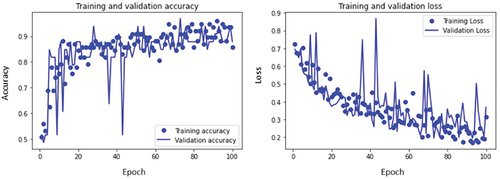
Figure 8. Accuracy curve and loss curve of moderate glaucoma class.
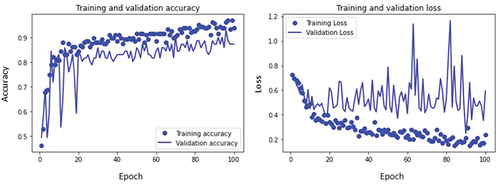
Figure 9. Accuracy curve and loss curve of severe glaucoma class.
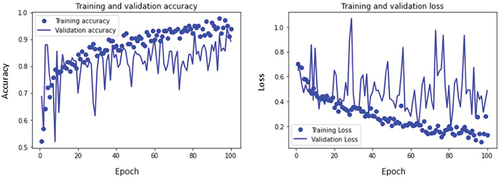
Table 5. Training and validation accuracy of glaucoma dataset.
Figure 10. Confusion matrices for (a) mild glaucoma (b) moderate glaucoma (c) severe glaucoma.
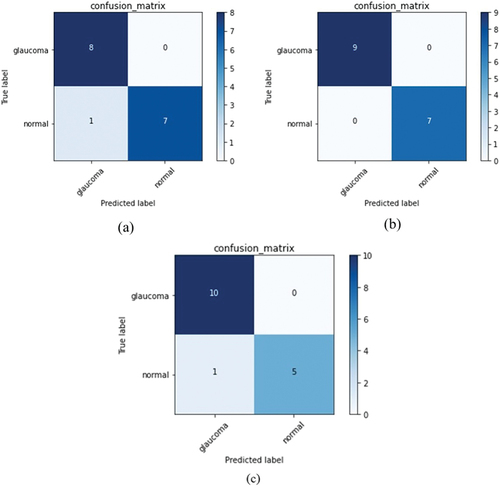
Table 6. Results of performance metrics evaluated for the deep CNN architecture.
Table 7. Comparison of result of test accuracy for proposed deep CNN model and ImageNet trained architectures.
Table 8. Comparison of performance metrics evaluated for the existing models vs proposed model.