
Figures & data
Figure 1. Conceptual comparison between the color management processes of traditional and digital pathological diagnoses.
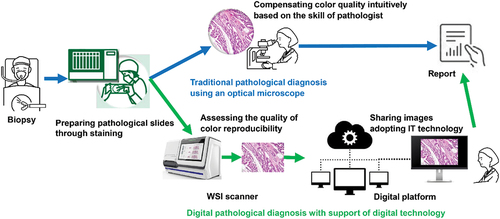
Figure 2. Configuration of the objective evaluation method for WSI system color reproduction.
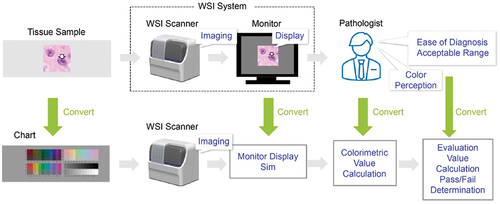
Figure 3. Example of an evaluation point set for the feature of a small artery. Evaluation points a through F were selected as candidates for evaluating the reproducibility of the true color values. (A. Angiocentric void, B. smooth muscle cell nucleus, C. smooth muscle cell cytoplasm, D. surrounding cell cytoplasm, E. connective tissue, F. endothelial cell nucleus).
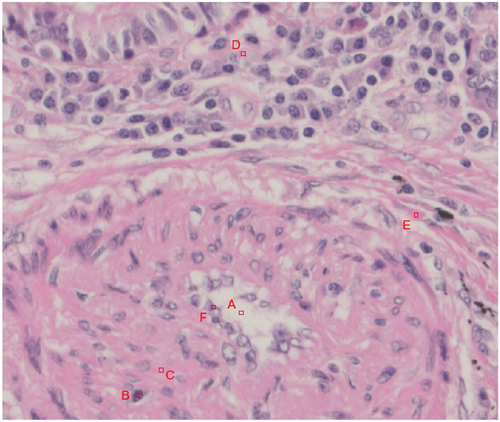
Figure 4. Prototype slide chart.
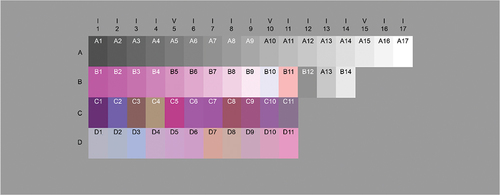
Figure 5. Conceptual diagram of acceptable ranges set in L*a*b* (L*c*h) space for evaluating the reproducibility of true color values. Left: Acceptable range defined by the upper and lower limits along each axis in the cross-section of lightness L* and chroma C*. Right: Acceptable range defined by the upper and lower limits for hue hab and chroma C*ab in the a*b* plane, respectively.
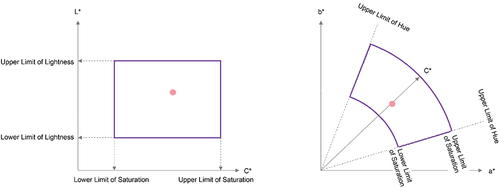
Figure 6. Overall configuration of the method for evaluating the reproducibility of true color values.
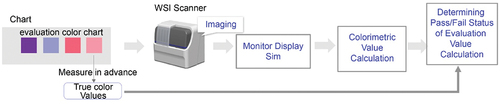
Figure 7. Example of a discrimination point set for a small artery feature.
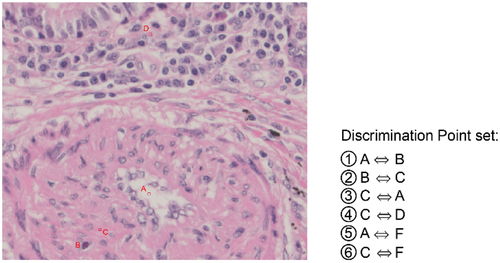
Figure 8. Overall configuration of the color discrimination evaluation method. The figure shows discrimination between the color of the cell nucleus within the granuloma and the color of the fibrous tissue outside the granuloma. Modulation was conducted so that the difference between the two colors near the center increased from left to right in the upper row and then left to right in the lower row.
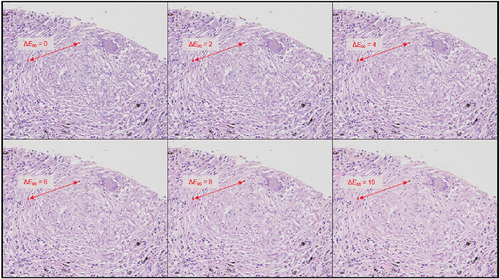
Figure 9. Overall configuration of the color discrimination evaluation method.
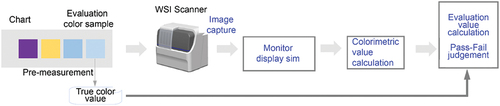
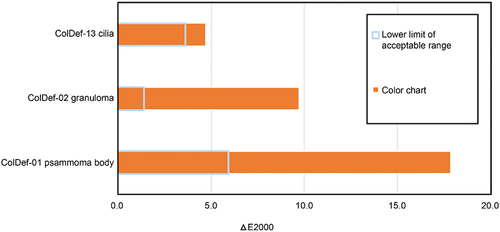
Figure 10. Results of the true color value reproduction evaluation experiment for the WSI scanner prototype.
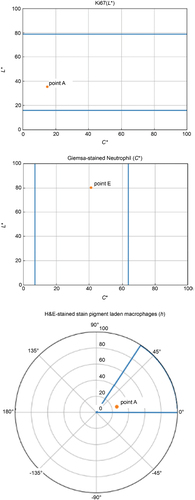
Figure 11. Results of the color discrimination evaluation experiment for the WSI scanner prototype.
Data availability statement
The datasets used and/or analysed during the current study are available from the corresponding author on reasonable request.