
Figures & data
Table 1. Review of some recent BAA methods.
Figure 1. Steps of six ROIs’ extraction from an X-ray image from DHA database.
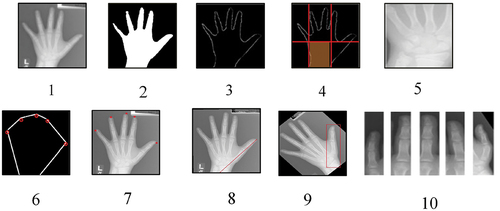
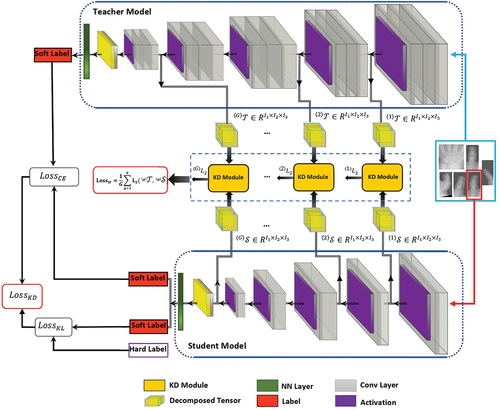
Figure 2. Diagram of student’s learning procedure based on hybrid KD model.
Table
Table 2. Evaluation results of six students and the teacher model.
Table 3. Comparison of the student-6 and the teacher regarding complexity and size of network.
Figure 3. The confusion matrices for age classes of (a) teacher model and (b) student-6 model.
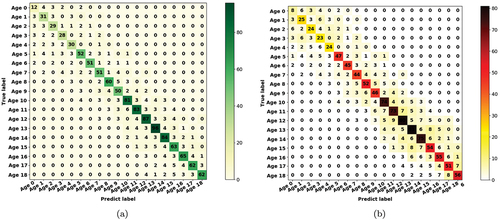
Table 4. Performance of the student-6 model for all 19 bone age classes.
Table 5. Performance of the teacher model per each 19 bone age classes.
Table 6. Comparing analysis of student-6 results with the student model from three other KD methods.
Table 7. Results of comparison the paired t-test of the proposed method and three other KD approaches.
Table 8. Performance evaluation of the student-6 and some state-of-the-art studies.